This Troubleshooting Guide outlines frequently encountered problems and their solutions.
Consult the list of topics in the menu to find a solution for your issue. If you've already checked this guide and still haven't solved your problem, contact our fast and friendly Support Desk!
If you've tried to sign up for a Gorilla account via our signup page but have not been able to complete the process:
If you are expecting an email verification message from us but have not received it, be sure to check your spam/junk folder, as these messages sometimes get filtered there.
If you have requested a verification code several times, only the most recent code will be valid.
Some email providers, such as Outlook, convert links to "safe" links automatically, which can cause problems when clicking them. If clicking the link in your email doesn't work, try copying and pasting the link directly into your browser instead.
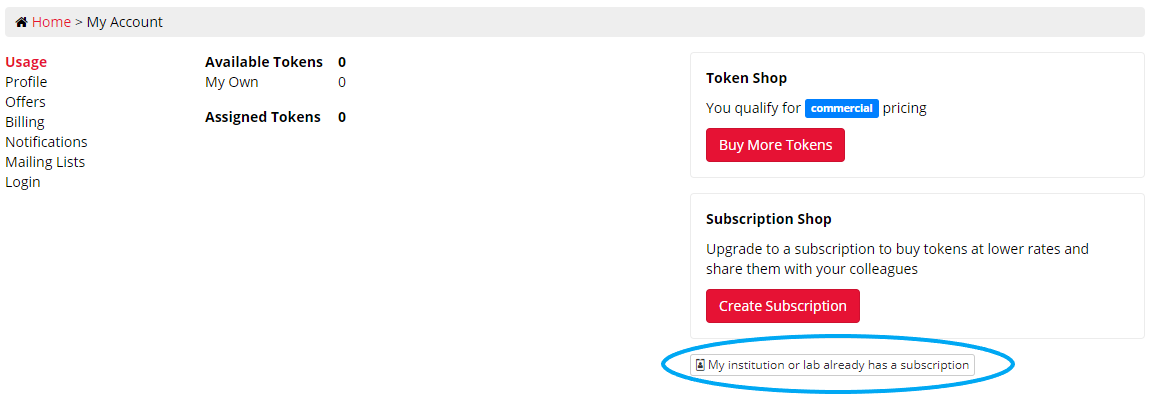
If you enter your enrolment code during signup and nothing happens, skip this step and continue with the rest of the signup process. Once you're logged in to your account, go to My Account. Click the button 'My institution or lab already has a subscription':
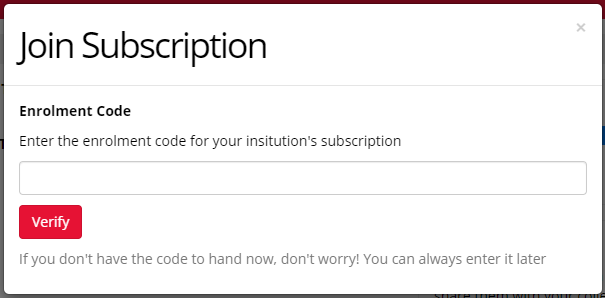
This will open a window where you can enter your enrolment code:
If you're still having trouble signing up after following the above steps, contact us and we'll try to assist!
If you're unable to get into your Gorilla account via our login page:
Academic IT accounts often have multiple email addresses that go to the same inbox, such as IDnumber[at]university.ac.uk or firstname.lastname[at]university.ac.uk or firstinitial.lastname[at]university.ac.uk or name[at]student.university.ac.uk - we've seen so many combinations!
If you already have a Gorilla account but are having trouble logging in, try all of the email addresses you have with your institution, in case you signed up to Gorilla with a different email.
If you are expecting a password reset message from us but have not received it, be sure to check your spam/junk folder, as these messages sometimes get filtered there.
Some email providers, such as Outlook, convert links to "safe" links automatically, which can cause problems when clicking them. If clicking the link in your email doesn't work, try copying and pasting the link directly into your browser instead.
If you're still having trouble logging in after following the above steps, contact us and we'll try to assist!
Tokens available to you will appear when you increase the Recruitment Target on an experiment. You should see something like this:
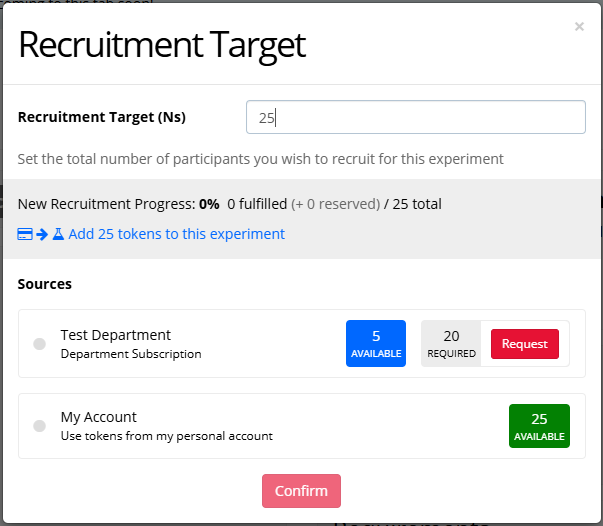
Under 'Sources', you should see:
Academic IT accounts often have multiple email addresses that go to the same inbox, such as IDnumber[at]university.ac.uk or firstname.lastname[at]university.ac.uk or firstinitial.lastname[at]university.ac.uk or name[at]student.university.ac.uk - we've seen so many combinations!
If you were invited by your institution to sign up for Gorilla, make sure the email address you sign up with matches the email address the invitation was sent to. This will ensure you can easily access your subscription once you have finished signing up.
You can change the email address on your account by going to My Account, clicking the Login tab, and clicking 'Change my email'.
For some subscriptions, your institution will provide you with an enrolment code. To enter the enrolment code and access your subscription, go to My Account. Click the button 'My institution or lab already has a subscription':
This will open a window where you can enter your enrolment code:
If you've tried the steps above and still don't see your subscription when you increase your recruitment target, you will need to contact your subscription administrator to ask them to invite you to the subscription via the email address you use to log into your Gorilla account.
Tokens that are already assigned to an experiment will not show up as available for assignment to another experiment.
If any experiments have a Recruitment Target that is higher than the amount of tokens reserved or consumed by participants, you can decrease the recruitment target to return these tokens to your account.
The one exception is if the tokens assigned to an experiment are from a previous subscription period - in this case, they can only be used on the experiment they are assigned to. If you unassign them from this experiment, they will be removed from your account. You can find out more about what happens at the end of a subscription period in our Subscription FAQ.
If you have requested tokens from your subscription by pressing the 'Request' button in the Change Recruitment Target window, the subscription administrator must approve your request in order for the tokens to be added to your account.
If you try to request tokens and see the following popup, this means you already have an open token request:
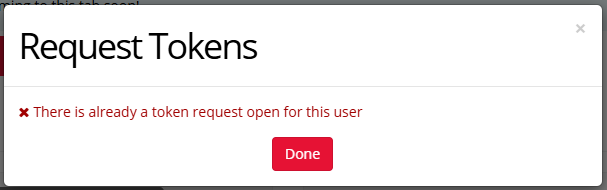
If the token request has been open for a while and you think it may have been overlooked, contact your subscription administrator to ask them to approve it.
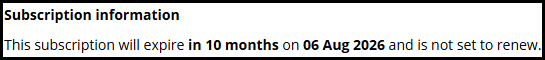
You can find your subscription status in My Subscription. Here, you should see when your subscription will expire and if it is set to renew:
If your subscription is set to renew:
If your subscription is not set to renew:
See our guide to what happens to tokens when your subscription ends or renews for more information.
You can find out how many tokens have been consumed in each of your experiments by consulting the Recruitment Progress Table on the Recruitment tab. The number under Participants in this table gives you the total consumed tokens in this experiment.
A token is consumed either when a participant reaches the Finish Node, or when you manually include them. Consuming a token is a permanent action: if you include a participant and then subsequently reject or delete them, the token will not be returned.
If you still can't find your tokens after checking the above steps, contact our support team!
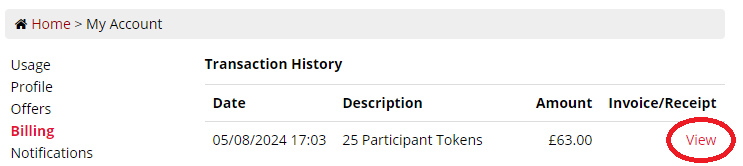
Gorilla will automatically issue you with an invoice for every purchase you make on the site. To view your invoices, go to My Account and click the Billing tab. To view an individual invoice, click 'View' on the right.
Pricing shown in the screenshots below may be outdated - please check our Pricing page for up-to-date pricing!
You can find more information about how to view invoices and receipts in our Pricing FAQ.
If you still have questions about your invoice, contact our support team!
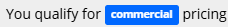
To check what pricing tier you're currently on, click the Usage tab in My Account and click the link on the right to open the Token Shop. The popup window will show your pricing tier.
When a new user signs up, we use an automatic filter to check for academic email addresses. Sometimes, an academic email address slips through our filter - if this applies to you, contact our support desk to get your academic email domain added to our filter. Once this has been done, your account will automatically switch to academic pricing.
If you are in the public sector and would like to access public sector pricing, contact us at info@gorilla.sc.
You want to edit a task, questionnaire, or experiment, but when you try to make changes, you get an error message.
To figure out why this is happening, try the following steps:
If you see the message:
'You do not have permission to make changes'
This means one of three things:

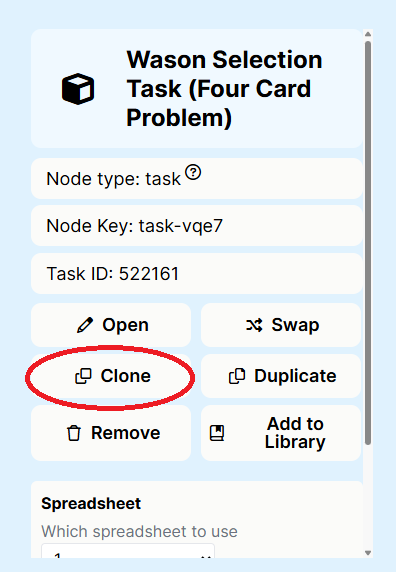
(This screenshot shows the new Experiment Builder interface. For details on how to do this using the classic interface, see the 'Cloning an Activity from an Experiment' dropdown in our Cloning guide.)
You will be asked if you want to rename the task, and if you want to update all nodes in the experiment tree to use the newly cloned version of the task. Leave this setting as default ('Update all nodes in this experiment tree'). Press Clone.
Repeat this for all unique task and questionnaire nodes in your experiment. You should now be able to edit all the tasks and questionnaires within your cloned experiment.
If you see the message:
'[Name] is already editing this task. Once they commit (or revert) their work, you will be able to edit it again.'
This means a collaborator on the project currently has an open edit. You will need to contact the named person directly and ask them to commit or cancel their changes so you can open your own edit.
If you have no way to contact the person with the open edit, an alternative (in Task Builder 2, Questionnaire Builder 2, Game Builder, and Shop Builder) is to export the current version of the task and import it into a new task.
To do this:
You can now make changes in your own version of the task.
If you are trying to edit an experiment, or a task in our legacy tools, you will instead have to clone the latest committed version to create your own editable copy. Find out more about cloning a task/questionnaire and cloning an experiment.
If you try to change the name of a task, questionnaire, experiment, or project, you may see an error message alerting you that names can only contain certain characters. You will not be able to change the name until you remove all disallowed characters from the name.
Names can only contain alpha numeric characters, hyphens, apostrophes and underscores.
If you've tried the steps above but are still unable to make changes, contact our support team!
To delete participant data, see our Participants Guide.
To delete your Gorilla account, see our FAQ.
For guidance on deleting tasks, questionnaires, and experiments, read on!
In Gorilla, tasks, questionnaires, and experiments cannot be deleted. They can be archived instead.
Open the Project that contains the item you want to archive. Click the Options button on the right of the item and select 'Archive'. This will remove it from the default view of the project folder.
If you change your mind, recovering a task, questionnaire, or experiment is simple. Click 'Open Archive' above the relevant section of the project folder. Click the Options button on the right of the material you want to restore, and select "Unarchive". The task, questionnaire, or experiment will then be restored to your project folder.
You're previewing your Task Builder 2 task and it's been working fine (so you've seen more than just a blank screen). But then suddenly, it gets stuck and won't move on.
If the preview gets stuck somewhere in the middle:
Three things can make a Gorilla task move on from the current screen:
If a screen does not have any response or continue components, and does not have a time limit, then the task will remain stuck on that screen indefinitely.
To check if your screen has a way to advance:
Even if you've added a response or a continue component, it might not be accessible on the device you're previewing from. To check if this is the case:
Also, make sure the response method you've chosen makes sense for the device you're previewing from. We advise against using Keyboard Responses on tasks designed for mobile, since the popup keyboard may not appear, resulting in the screen getting stuck.
The Dropdown, Multiple Choice, Number Entry, Rating Scale, Slider, and Text Entry components have a 'Required' setting:
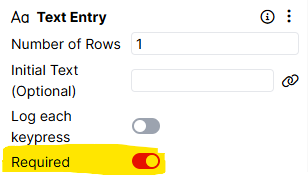
If this setting is toggled on, the screen will not move on until a response has been entered. If you want the screen to be able to advance even if a response isn't entered, toggle the Required setting off.
By default, a Gorilla task will move on from the current screen when the first response is received.
You can override this default behaviour by using Advance components. These components (Advance - Accuracy, Advance - Continue, Advance - Response, and Advance - Time Limit) can be added to the Screen tab, allowing you to decide which criteria you want to advance the screen.
For Multiplayer tasks, there is also the Advance - Multiplayer component, controlling whether one or all players can advance the screen.
Make sure the Advance component(s) you choose make logical sense for your task and don't conflict with each other. Common issues:
Sometimes, a task preview gets stuck because of an underlying issue with an audio or video file. For guidance on this, check out 'Video/audio not playing'.
If the whole preview runs fine, but then gets stuck on a blank screen at the end:
If the preview gets stuck on a blank screen at the end, this can be a sign of an upload error. This happens when you have recording components in your task (e.g. Audio Recording, Video Recording) that have not been set up correctly.
Most commonly, this is because the recording component has been deactivated (usually on screen start) and not activated again. This causes Gorilla to expect a recording file where none exists, leading to the task hanging at the end of the preview.
To resolve this issue:
If you've tried all the steps above and your task preview is still getting stuck, contact our support team!
You've set up your Task Builder 2 task and clicked Preview at the top right, but all you see is a blank screen!
(If you've successfully previewed your task but it gets stuck on a blank screen at the end, see the last section of 'Task preview gets stuck'.)
To get your preview running successfully, try the following steps:
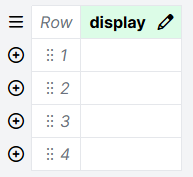
The display column of the task spreadsheet is the driving force of your task. When you click Preview, Gorilla looks for the display column in the spreadsheet, and shows the displays listed there in order from top to bottom.
If the display column is empty, Gorilla doesn't have anything to show when you preview the task.
To check this:
To fix this:
When you enter a name into the display column, Gorilla will highlight it in green if it matches one of the displays you have created on the Displays tab. If a cell in the display column is not highlighted in green, this means Gorilla cannot match it to one of the displays you have created.
To check this:
There are a few reasons why this might happen:
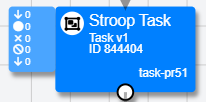
As an example, in the screenshot, Screen 1 and Screen 2 are the names of screens within the Task display:
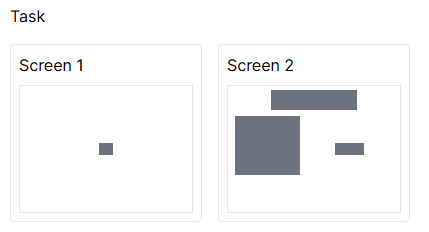
Task is what you would enter into the display column of the spreadsheet.
Empty/blank cells in the display column can cause problems for your preview:
To fix this, ensure any empty cells in the display column are deleted, or filled in with the name of one of your task displays.
If you've tried all the steps above and you still just get a blank screen when you preview your task, contact our support team!
You've set up your Task Builder 2 task and clicked Preview at the top right. You don't just see a blank screen, and your preview completes without getting stuck, but you don't see the full sequence of displays you're expecting.
To solve this problem, try the following steps:
The display column of the task spreadsheet is the driving force of your task. When you click Preview, Gorilla looks for the display column in the spreadsheet, and shows the displays listed there in order from top to bottom.
If a display is not listed in the display column of your spreadsheet, it will not be shown in your task preview.
To include a display in your task preview, enter the name of the display in the display column of your spreadsheet. To show a display multiple times, enter it in multiple rows.
Often, missing displays are caused by the same underlying problems that sometimes cause a task preview to appear blank. Check through the steps in 'Task preview is a blank screen' to solve the issue of missing displays.
If your task has an 'end' screen that you want to show participants after all the trials are finished, it needs to be on its own display.
Each time a display is listed in the spreadsheet, Gorilla will show all the screens in that display. This means if you add your end screen to the trial display, it will show at the end of every trial.
This is a common reason for missing displays in a preview - you see the end screen and think the preview is finished, but if you continued, you would actually see another trial followed by another end screen, etc.
To fix this problem, copy your end screen onto its own display, and delete it from the trial display.
If you've tried all the steps above and displays are still missing from your task preview, contact our support team!
You're previewing your Task Builder 2 task, and even though you're not finished with the current screen, it's already moved on to the next screen.
To get your screen advancing only when you want it to, try the following steps:
By default, Gorilla will move a task on to the next screen when the first response is received. To override this behaviour, you need to add an Advance component to the Screen tab.
Advance components are 'stackable' - for example, if you add both an Advance - Continue and an Advance - Time Limit component, the screen will move on either when the participant clicks Continue or when the time limit is reached, whichever happens first.
The Audio and Video components have a setting called 'Auto Advance'. If this setting is toggled on, the screen will automatically move on once the audio or video has finished playing.
If you do not want the screen to automatically advance once the audio or video has finished playing, toggle the 'Auto Advance' setting off.
If you just want feedback to display for longer before the screen moves on:
The Feedback Time component is designed to add an amount of time you specify to the end of the screen once all responses have been received. Add this component to the Screen tab and enter the time in milliseconds that you want feedback to display for.
If you've tried all the steps above and your screen is still moving on before it should, contact our support team!
You've added a Progress Bar to your task, but when you preview, it's filling up too quickly, too slowly, or not at all.
If you've already checked out our Progress Bar Tutorial, try the following steps to solve this problem:
The Progress Maximum setting on the Progress Bar component sets the number of 'segments' within the progress bar that can be filled in.
Make sure what you've entered matches the requirements of your task. For example:
The Progress Bar component is just the visual element that displays the progress bar on the screen. To keep track of participants' progress, you also need an Increase Progress component.
Add an Increase Progress component to the Screen tab of any screen(s) where the participant takes an action that increases their progress. Set up the Criteria to make sure you only increase progress under the conditions you want.
You can find an example of how to set this up in our Anagram Task sample.
The Progress Bar has a 'Use Custom field' setting. This enables you to retrieve the participant's current progress from a specific field in the Store, rather than just keeping track of it via the Increase Progress component.
You should only need to use a custom field if:
If none of these apply to your task, toggling off the 'Use Custom field' setting in both the Progress Bar and Increase Progress components in your task may solve your problem.
If you do need to use a custom Progress Field, make sure the correct Progress Field is selected in your Progress Bar component. If you're also using Increase Progress components, the Progress Field selected in these components must match the Progress Field selected in the Progress Bar component.
If you have Progress Bars in multiple tasks in your experiment, you need to decide if you want progress to accumulate across the whole experiment, or separately within each task.
By default, progress will accumulate across the whole experiment. If you want progress to reset between tasks, you will need to toggle on 'Use Custom Field' setting and specify a different Progress Field in each task.
If you've tried all the steps above and your progress bar still isn't working, contact our support team!
You've created your task displays, set up your trials in the spreadsheet, and hit Preview, but for some reason the same screen keeps coming up again and again.
To fix this issue, try the following steps:
The most common reason for repeated screens in a task preview is because you have created screens within the same display, when you should instead create separate displays.
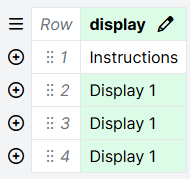
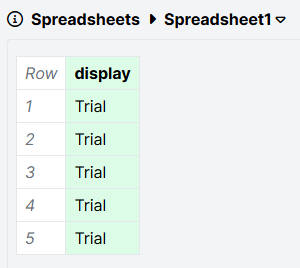
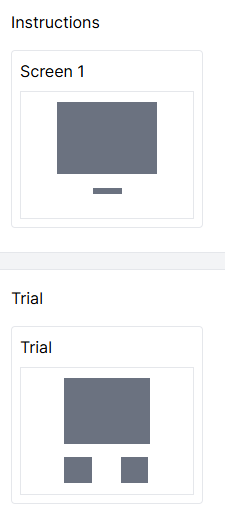
Here's an example of a display called Trial. It's been set up with two screens: an Instructions screen, then a Trial screen.

Here's the task spreadsheet, set up to show the Trial display 5 times:
And here's what happens when you preview the task:
The Instructions screen is shown before every single trial. This is because when you list a display in the spreadsheet, Gorilla shows all screens within that display.
To fix this problem and only show the instructions once, place the Instructions screen and the Trial screen on separate displays. In the spreadsheet, list the Instructions display once, and the Trial display as many times as you want trials. Here's what the displays in the task look like after the fix:
And the spreadsheet:
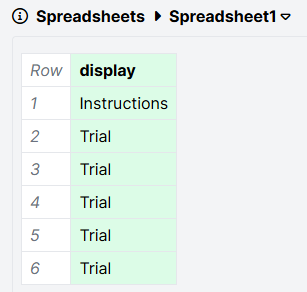
Previewing this version of the task results in the intended behaviour, where the instructions show once, followed by 5 trials.
In some cases, you might want to list the same trial content multiple times in the spreadsheet, and pick a subset of trials to show to a specific participant.
By default, Gorilla will show all the trials listed in the spreadsheet. To pick a subset of trials to show, use the Select Randomised Subset component.
To add this component, click 'Add Randomisation' in the Spreadsheet tab. Click 'Add Component', and select 'Select Randomised Subset'.
You can find a walkthrough of how to set up this component in our Advanced Spreadsheet Randomisations guide.
If you've tried all the steps above and you're still seeing the same screen multiple times in your preview, contact our support team!
You've tried to set up your task to skip some screens in a display using the Branch component, but it's not working when you preview.
Try these steps to fix the problem:
The Dropdown, Multiple Choice, Number Entry, Rating Scale, Slider, and Text Entry components are what we call passive response components. This means the response is not processed until after the screen is ready to advance.
This means you cannot directly branch based on a response from these components. As a workaround, you can do the following:
If you've set up multiple branching Destinations in the Branch component, a participant might match the criteria for more than one of them.
Destinations are evaluated in top to bottom order. This means a participant will be sent to the first Destination where they meet the criteria.
You can reorder Destinations by dragging them up and down within the Branch component:
If you've tried all the steps above and your screen branching still isn't working, contact our support team!
You're trying to use a Branch Node to send participants down different paths in your experiment based on their previous responses or performance, but it's not working.
When you preview, either participants are all sent down the same branch, or the branch they see doesn't match where they should go.
If you're having this problem, try the following steps:
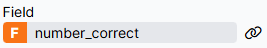
For the Branch Node to work, the data you're trying to base the branching on (such as a participant's response in a questionnaire, or their score in a task) must first be saved to the Store.

Instead of saving the information to a field called number_correct, this will save the information to a field named after the contents of the number_correct field. This will prevent the information from saving properly. To fix this, click the binding icon to the right, toggle off 'Show Advanced Settings', and click Bind. You should see the bound field without the additional 'F':
If you've saved your information to the Store but your branching still isn't working, the next step is to check within your task or questionnaire that the information is saving correctly.
An easy check is to display the contents of the Store field later in your task or questionnaire. You can then preview the task or questionnaire and check the right information is being saved to the Store.
To do this, add a Markdown Text component to a later screen of your task, or a Text object to a later page of your questionnaire. In the Text setting, enter:
Store field contains: ${store:field-name}
where field-name is the name you've given to the Store field where you're saving the information.
Now, preview your whole task or questionnaire using the Preview button at the top right. When you get to the screen/page with the text you just created, check if the value after the colon matches what you expect the Store field should contain.
If not:
If so:
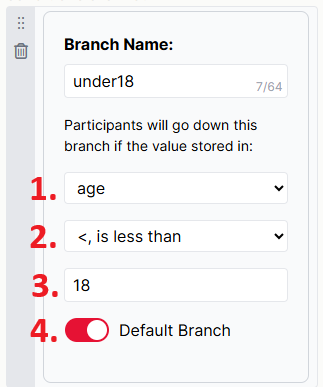
To work, the Branch Node needs four pieces of information:
For walkthroughs of how to set up the Branch Node, check out our tutorials:
A Branch Node can only check one criterion. If you're branching based on multiple criteria - e.g. a participant failed attention check 1 AND attention check 2; a participant selected French OR Spanish as their native language - then you have two options:
If possible, combine your multiple criteria into a score. You can do this using the Scoring tab in Questionnaire Builder 2, or using the Save Accuracy or Save Data components in Task Builder 2. You can then select this score as the Store field in your Branch Node.
If the criteria can't be combined into a score, you will need to chain multiple Branch Nodes together to check the criteria one by one. You can see an example of how to do this in our Advanced Branching Tutorial.
Sometimes, you've set everything up correctly, but haven't taken the final step of committing the changes to your task/questionnaire and updating the nodes in the experiment tree. This means the experiment is still using an old version of the task/questionnaire, which can stop your branching working correctly.
To fix this:
You can find more detailed instructions on updating your nodes in our Experiment Builder How To Guide.
If you've tried all the steps above and your branching still isn't working, contact our support team!
You've previewed each of your individual tasks and questionnaires, and they're working fine. But when you click the 'Preview' button at the top of your experiment, you don't see what you expect.
If you see the error message No-Spec-1, check out 'Error No-Spec-1'. Otherwise, try the following steps:
When you clone an experiment, you have the option to also clone tasks and questionnaires within the experiment and update the experiment to use the cloned versions.
If you did not select this option, or if you cloned your experiment before this option was available, your experiment may still contain tasks and questionnaires located in the original experiment's project.
Even if you have separately cloned and edited the tasks and questionnaires to create new versions within your own project, you will still need to manually update the nodes in the experiment tree to use these new versions.
To do this, click on the task or questionnaire node in the experiment tree, and click Swap:

If you are still using the classic version of Experiment Builder, you will instead need to click 'Options', then 'Use a different task/questionnaire'.
You will be asked if you want to update all nodes in the experiment tree to use the newly cloned version of the task. Leave this setting as default ('Update all nodes in this experiment tree'). Find the version of the task or questionnaire that exists in the current project, click it, and click Replace/OK.
Repeat this for all unique task and questionnaire nodes in your experiment. You should now be able to preview your experiment successfully.
Sometimes, you've set everything up correctly, but haven't taken the final step of committing the changes to your task/questionnaire and updating the nodes in the experiment tree. This means the experiment is still using an old version of the task/questionnaire, which can stop your experiment preview working correctly.
To fix this:
You can find more detailed instructions on updating your nodes in our Experiment Builder How To Guide.
When you add a task to your experiment, you can configure which spreadsheet you want to use and set the value of any manipulations. If this isn't done correctly, it can cause problems with previewing your experiment.
To check you've set up spreadsheets and manipulations correctly:
Each Control Node that you add to your experiment tree has its own configuration settings. If you've followed the steps above and are still having problems previewing your experiment, check the settings on each of your Control Nodes.
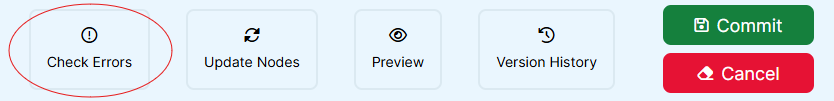
The best way to check if you've made a mistake in connecting your experiment tree nodes is to use the Check Errors option.
If you're using New Experiment Builder, click the 'Check Errors' button in the top bar:
If you're using Classic Experiment Builder, go to the Utilities menu at the top right and select 'Check For Errors'.
Gorilla will check your experiment tree and show you if any errors have been found. For example, if you have connected back to a node the participant has already completed, you will see the following error message:
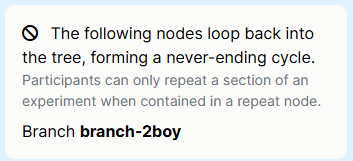
Follow the advice given to fix the error. In this case, instead of looping back to a node the participant has already completed, add a Repeat Node to make participants repeat a section of your experiment.
If you've tried all the steps above and your experiment preview still isn't working, contact our support team!
You've just tried to preview your experiment, and you see the following error message:
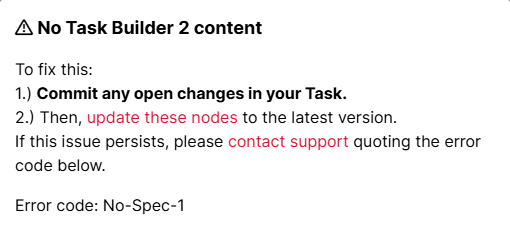
The heading might be 'No Questionnaire Builder 2 content' if the problem is with a questionnaire rather than a task.
To fix this:
You should then be able to preview your experiment successfully.
If you've followed the steps above but are still seeing the No-Spec-1 error, contact our support team!
You've uploaded your audio or video files to the Stimuli tab and incorporated them into your task with an Audio or Video component. But when you preview the task, the video or audio doesn't play.
Try the following steps to solve this problem:
There are four main issues with audio/video files uploaded to the Stimuli tab that cause them not to play:
If your audio or video component is bound to the spreadsheet, two other common problems are:
Media files will not play automatically by default. You will need to set up your Audio or Video component to make your media play.
Gorilla's default behaviour is for the first response to advance the screen. If you set up your media to play following a certain response, you also need to add an Advance component, such as Advance - Continue, to the Screen tab to prevent this response from immediately advancing the screen.
If you've been previewing your task in one browser and encountered problems with audio or video, try previewing in a different browser.
If you find the issues are specific to a particular browser, you can use recruitment requirements to restrict participants using the problematic browser from entering your experiment.
Please do also let our support team know so we can investigate the issue and keep other researchers informed!
Even if you've fixed problems with your media files, your browser might still have the old versions in its cache, meaning the problem still occurs when you preview the task.
Try clearing your browser cache and then previewing your task again.
All major browsers disallow autoplaying of audio. Gorilla has ways of working around this, but if your audio or video file is set up to play without the participant clicking something, you may still experience problems.
Check out our guide to autoplay restrictions for more information and possible workarounds.
If you've checked all the steps above but your audio or video still isn't playing, contact our support team!
You've uploaded your image or video files to the Stimuli tab and incorporated them into your task with an Image, Video, or similar component. But when you preview the task, the images or videos don't appear.
If you're experiencing this problem, try the following steps:
Uploading your files to the Stimuli tab is just the first step - to show them to your participants, you also need to add the right component to one of your task screens.
A quick guide to the components that can display images/videos:
For each of these components, you can specify which image(s)/video you want to show using the 'Choose...' dialog, or bind to the spreadsheet to vary images/videos trial by trial.
You can also use the HTML component to show images with custom formatting, or embed a video from an external source such as YouTube.
If the files you've uploaded to the Stimuli tab are too large, this is likely to lead to loading delays.
Our Technical Checklist has guidance on file sizes and how to compress files.
If large files are necessary for your task, you can adjust the Lookahead settings to load the stimuli before the task begins.
If your image or video component is bound to the spreadsheet, two other common problems are:
If you've tried all the steps above but your images/videos still aren't appearing, contact our support team!
You've set up the elements of your task screens, such as text and responses. But when you preview, the text overlaps with other visual elements (such as buttons), or doesn't all fit on the screen.
This happens when there is too much content on the screen for the dimensions of the device you're previewing on.
To fix this:
For more information, check out our overview of responsive task layouts.
If you've tried the above and your text is still not displaying as you want it to, contact our support team!
You're trying to give your participants feedback on whether their responses are correct or incorrect on each trial, but it's not working!
To fix this, try the following:
Feedback will only display correctly if the underlying scoring is working. First, check if the scoring for your task is working correctly.
To do this:
There are four ways of showing feedback in a Gorilla task. Pick the one that makes sense for your task:
If:
and
You'll need a way of overriding Gorilla's default behaviour, which is to move on to the next screen when the first response is received.
The most common solution is to add an Advance - Accuracy component to the Screen tab, and select 'First Correct Response'. This allows the participant to give as many wrong responses as they want, and be given feedback on each, before they finally give a correct response and move on to the next screen.
If you've tried these steps and your feedback still isn't displaying as you want it to, contact our support team!
You're trying to score participants' responses in your task as correct or incorrect, but it's not working - when you look at on-screen feedback or the Correct column in the data file, you don't see what you expect.
To fix this, try the following steps:
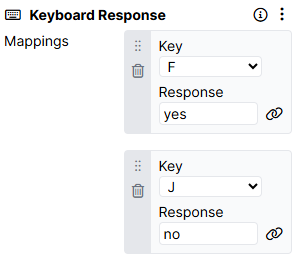
Mouse and keyboard response components (Click Response, Keyboard Response, and Mouse Button Response) have one or more Response settings.
What you enter in the Response setting is what will be recorded when the participant clicks the mouse or presses the keyboard.
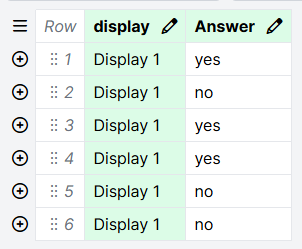
For example, in the screenshot below:
What usually changes from trial to trial is the correct answer - check the next step for how to make sure you have set this up correctly.
To mark responses as correct or incorrect, you need to tell Gorilla the correct answer(s) for each trial. Do this by adding a Scorer component to the Screen tab of the screen where you collect the response. If there are many possible correct answers, you can instead add a Scorer (Multi) component.
In most tasks, the correct answer changes from trial to trial. The setup for this looks like the following screenshot:

The Correct Answer setting is bound to the spreadsheet column 'Answer'. You would then set up your spreadsheet so that on each row, the Answer column contains the correct answer for that trial:
The Correct column in your data file contains a 1 in rows that are scored as correct, and a 0 in rows that are scored as incorrect.
However, your data file contains many rows that do not correspond to the participant responses you're interested in: for example, rows where the participant pressed a Continue button, or rows where the screen timed out. For all these rows, the Correct column contains 1 by default.
To locate the rows in your data that correspond to participant responses, look in the Response Type column for the value 'response'. This denotes a response from a response component.
You can find more information about the different response types and what they mean in our Response Processing Guide.
The Scorer component is designed to score each participant's response as either correct or incorrect in a binary fashion.
If you have more complex scoring needs (e.g. awarding 2 points for each correct answer, or taking away points for incorrect answers), you will additionally need to use a Save Data component.
You can find out more in our Tutorial on calculating and displaying custom scores.
If you've tried all the above and your scoring still isn't working, contact our support team!
You've added spreadsheet randomisation to your task, but when you preview your task, you don't see the randomised trial order you expect.
To solve this problem, try the following steps:
Here's a quick guide to which randomisation component to use for a range of common cases:
Here's an example of the Randomise Trials column set up correctly. The selected column contains a 1 in every trial row:
Spreadsheet randomisation shuffles the order in which displays are shown within a task. It cannot randomise the order of screens within a display.
If your task trials are set up as screens within a display, you cannot use spreadsheet randomisation to randomise their order. To fix this:
If you've tried all these steps and are still having issues with your spreadsheet randomisation, contact our support team!
You've set your recruitment target and picked a recruitment policy, but participants are reporting that they're unable to access your experiment.
Check the following steps to fix this problem:
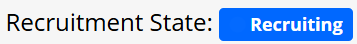
You can find the current state of recruitment on the Recruitment tab of your experiment.
If you are actively recruiting participants, the recruitment state should be 'Recruiting':
If instead you see 'Full', this means there are currently no spaces in your study for new participants:
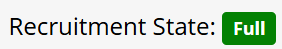
To fix this, you can either:
To change the recruitment target:
You can view and change the currently selected recruitment policy on the Recruitment tab of your experiment.
Gorilla offers a number of built-in recruitment policies. If you are recruiting your participants from:
Then you should use the built-in recruitment policy corresponding to that recruitment service. Click the links above to find setup instructions for each policy.
When using a built-in recruitment policy, make sure you copy and paste the Study URL from the Gorilla side into the recruitment service, and double-check that it matches exactly.
If you are using a third-party recruitment service that does not have a built-in integration with Gorilla, you need to set this up yourself using the Third Party recruitment policy. You can find detailed instructions in our Custom Third Party Setup guide.
?external_id=[PARTICIPANT_ID] on the recruitment service website?external_id=[PARTICIPANT_ID] is a placeholder for the specific participant's ID. The specific participant's ID must be passed to Gorilla from the external site as a parameter at the end of the URL.? removed.external_id.If you've checked the steps above but your participants are still unable to access your experiment, contact our support team!
You're sure some participants have finished your experiment, but when you look at their status on the Participants tab, it says they're still Live. When you click 'View Progress', it looks like they've been on the final task in your experiment for hours.
The most common reason is that participants got stuck on the final screen of the final task. This happens for one of the following reasons:
To fix this problem:
New participants will take part in the updated version of your experiment, which should prevent the problem occurring in future.
If this still hasn't resolved your problem, contact our support team!
Participants are starting to take part in your experiment, but not many of them are finishing - it seems like many participants are getting stuck.
Participants getting stuck can signal a problem with your experiment. Alternatively, it might just be normal attrition.
The best way to figure out what's going on is to look at where your participants are getting stuck.
Some functionality, such as audio and video recording and multiplayer, is more technically demanding - depending on the participant's computer, browser, and internet connection, tasks using this functionality may experience higher levels of technical attrition.
If you find a specific problem, edit the affected task/questionnaire to fix it, commit your changes, edit your experiment, update your nodes, and commit the new version of your experiment.
New participants will take part in the updated version of your experiment, which should prevent the problem occurring in future.
Existing participants are locked in to the version of the experiment they started. For these participants, you have two options:
If you want to use the data a participant generated up to where they got stuck, you can manually include them - this will immediately and irreversibly consume a token.
If you want an existing participant to take part in the fixed version of the experiment, you will need to delete them from the Participants tab and invite them to participate again from the start.
If you've tried the above and your participants are still getting stuck, contact our support team!
Participants are trying to take part in your experiment, but they are encountering the error message No-Mani-1.
To fix this problem, try the following steps:
If a participant is using a VPN, this can interfere with Gorilla contacting its servers to download content and stimuli.
If your participant is seeing the No-Mani-1 error, advise them that any VPN they use should be turned off while they are participating in the study.
The same problems that apply to VPNs can also apply to ad blockers - if your participants are seeing the No-Mani-1 error, advise them to disable/turn off their ad blocker while participating in the experiment.
Browsers in private or incognito mode cause particular issues for Multiplayer experiments, but can also affect the running of experiments more generally, since it does not allow loading and storing of task data in the same way as normal browser mode.
If your participants are seeing the No-Mani-1 error, advise them not to use incognito or private mode when participating in the experiment.
If you've tried the steps above and your participants are still seeing the No-Mani-1 error, contact our support team!
You're trying to test the flow from Prolific to your study to make sure Prolific IDs are recording correctly on the Gorilla end. But when you try to access the study as a participant from your Prolific account, you're sent straight to the end of the experiment.
This happens because you've already previewed as a real participant from Prolific, so Gorilla recognises you as a returning participant and resumes you from where you left off.
To reset your progress and preview the whole experiment as a new participant again:
You can find more information and screenshots in our guide to deleting participants.
Once you have deleted yourself as a participant, you should be able to participate in your study from Prolific from the start again.
If you've tried the steps above and are still having issues previewing from Prolific, contact our support team!
You want an equal number of participants to be assigned to each condition of your experiment. But now your experiment is live, you're looking at the Data tab, and more participants are being assigned to one condition than to the other(s).
To fix this, try the following:
There are two Experiment Tree Nodes that randomly assign participants to conditions of a task.
For the Randomiser Node, the Randomisation Mode setting determines how your participants will be randomised between conditions.
Participants don't always finish every experiment they start. If a participant drops out after being randomised to a condition, this can affect the balance of your conditions, depending on the node you are using:
Both the Allocator Node and the Randomiser Node reset with every new experiment version. If you make changes to your experiment and commit them, participants will be assigned to conditions according to the current node settings, regardless of how many were assigned to each group in previous experiment versions.
To walk through an example: you're aiming for 50 participants in condition A, and 50 participants in condition B. To achieve this, you've set up an Allocator Node with the maximum number of participants set to 50 for condition A and 50 for condition B.
You've reached 45 complete participants in Condition A and 42 complete participants in Condition B when you realise you need to make a change to your experiment.
When making the change, you should also change the Allocator Node settings to adjust the maximum number of participants for each condition. To achieve your target of 50 participants in each condition, set the maximum number of participants to 5 for condition A and 8 for condition B.
Once you commit your changes to the experiment, new participants will be allocated according to these settings, ensuring you don't exceed your target.
If you've gone through the steps above and are still ending up with unbalanced condition groups, contact our support team!
From looking at the data, it seems that the same participant has taken part in your experiment twice.
To find the source of this problem, try the following steps:
The Simple Link recruitment policy allows for easy distribution of your experiment participation link. However, when using this policy, the experiment link is not personalised - the same participant could click the link again and they will be processed as a different participant with a different ID.
To prevent the same participant from taking part again, use a recruitment policy that tracks participant IDs from an external source, such as an email recruitment option, or one of our integrated third party recruitment options.
We are aware of some cases where participants accessing Gorilla experiments via Prolific have later accessed the same experiment again by manually changing the Prolific ID in the experiment URL.
If you think this may have happened in your study, the best way to resolve it is to contact the participant directly via a Prolific message.
If you've gone through the steps above and are still unsure how a participant took part in your study twice, contact our support team!
One of your participants is listed on the Participants tab as Rejected, but you're not sure why.
The most common reasons for this are:
Participants who either manually return the study on Prolific, or are timed out by Prolific, will automatically be rejected on the Gorilla side as well.
These participants will show up in your Participants tab as RejectedManual.
If you have set a Time Limit on your experiment, any participant who takes longer than this to complete your experiment will be automatically rejected.
The Time Limit applies to any participant who starts the experiment while a Time Limit is in force, even if you subsequently remove that Time Limit while the participant is still live.
A participant who exceeds the Time Limit will be rejected as soon as they finish the task/questionnaire they were doing when the time limit expired. They will show up in your Participants tab as RejectedTime Limit.
If you've checked the reasons above and are still not sure why your participant was rejected, contact our support team!
You've received an email from Gorilla that starts 'A participant is attempting to take part in your Gorilla experiment but your recruitment target has been reached.'
This email is triggered when a participant tries to access an experiment where:
The action you should take on receiving this email depends on whether this is a study where you are actively recruiting participants.
You've downloaded your experiment data and are starting to look through it, but you're having trouble finding the information you need.
To solve this problem, try the following steps:
'What do all the different Reaction Time measures mean?'
'What do the date and time columns show?'
'What does [column name] mean?'
For questions like these, the best place to start is our dedicated Data Columns guide. Search the page for the column name you're interested in - you'll find a definition of what the column contains and how it relates to similar columns.
For most studies, the key variables are:
Most of the time, you can identify the rows in your Gorilla data that contain participant responses by looking for rows where the Response Type column contains the value 'response'. (You can find more details, and exceptions, in our Response Processing Guide.)
Once you have found the appropriate row:
Our Data Analysis guides offer tips and examples on how to preprocess and analyse Gorilla data in R and Excel.
If you've tried the steps above and still don't understand what's going on in your data, contact our support team!
If an entire participant's data is missing, check out 'Can't find participants in my data'.
If just some of a participant's data is missing, check the steps below.
Sometimes data from a particular question or trial is missing because the participant was able to skip it without giving a response.
For example:
To check if any of these apply to your task or questionnaire:
If you can't reproduce the pattern of missing data, continue with the next steps.
In some cases, a participant only has partial data from a task or questionnaire because they never actually completed it.
This may be the case if you have manually included the participant in order to access their data.
You can view how far a participant got in your experiment on the Participants tab by clicking 'View Progress'. If this shows that they are still technically live on a particular task/questionnaire, and you are seeing incomplete data for that task/questionnaire, the most likely explanation is that they never finished it.
Each data file from a Gorilla task or questionnaire contains a row at the top where the Response column contains BEGIN.
If you see another row like this interspersed in your data file, it usually means the participant refreshed the browser. Gorilla then attempts to resume them from where they left off, but depending on the participant's connection, this could result in some trials being skipped.
If you've looked through the possibilities above and are still seeing inexplicable missing data, contact our support team!
You know a participant with a given ID has taken part in your experiment, but when you generate and download your data, you can't find that participant.
Try the following steps to solve this issue:
By default, data you download from Gorilla is blinded. Data files contain only the internally-generated Participant Private ID, and not the Participant Public ID, which corresponds to the ID assigned by you or an external service such as Prolific.
To include Participant Public IDs in your data, tick Unblind when generating your data.
Gorilla data contains many columns!
The participant ID is in the Participant Public ID column. If this column contains the text 'BLIND' in every row, then your data is blinded - go back to the previous step to find out how to unblind it.
Participants take part in the latest committed version of your experiment at the time they start.
If you make changes to your experiment during recruitment and commit those changes, new participants will access the new version of your experiment. This can lead to data from different participants being split across different experiment versions.
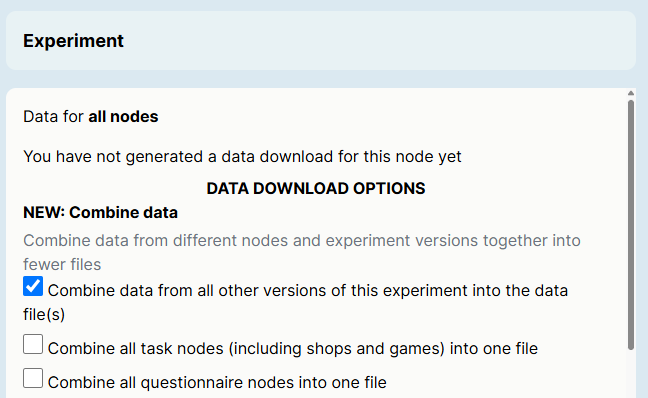
To ensure data from all versions is included in your data download, go to the Data tab. Click 'Download Experiment Data' and check 'Combine data from all other versions of this experiment into the data file(s)':
If you then click 'Regenerate Data' and download the resulting files, you should see all your participants included.
When generating data, you have the option to select the timeframe you want data from:
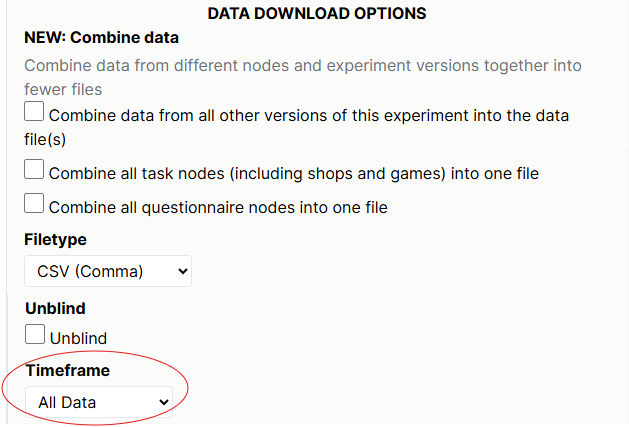
Make sure the timeframe you have selected includes the time when the participant you're looking for took part. If it does not, adjust the timeframe, click 'Regenerate Data', and download the resulting files.
If you've tried all the steps above and still can't find participants in your data, contact our support team!
You're looking at your experiment data, and what you see in the Response column doesn't match the response you think should have been recorded.
This is usually because of how you have set up your Responses in your questionnaire or task.
If you've checked your Responses but are still seeing wrong values recorded in your data, contact our support team!
You're looking at your experiment data and it seems the same row is repeated several times.
For guidance, try the following steps:
When you generate your data, if you select long-form questionnaire data, you have the option to include additional metrics:
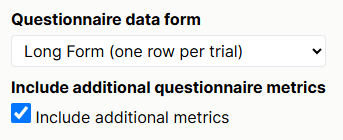
If you tick this box, your data file will contain an additional 'action' row showing a snapshot of what participants' responses looked like when each questionnaire page was submitted. To find participants' final responses, look for rows where the Response Type column contains 'response'.
Additional questionnaire metrics are useful for finding out if participants went back to a previous page and changed their answers before submitting the questionnaire. If you do not need this information, untick 'Include additional metrics' and regenerate your data.
Some task screens include many actions that get logged in Gorilla data: for example, a participant response, a time limit expiring, a continue button being clicked, etc.
To see which object a row corresponds to, check the Object Name column. This will make clear which event on the screen is recorded in that row.
If you've checked the possibilities above and are still finding repeated rows in your data, contact our support team!
You've used recording components in your task (e.g. Audio Recording, Video Recording), but when you download your data and look in the uploads folder, some recordings are either missing or won't open.
To figure out what's happened, try the following steps:
Some browsers and devices (particularly Safari and Apple devices) behave less robustly with audio and video recording in the browser.
Current known or suspected issues are in a Warning box at the top of the Audio Recording and Video Recording component documentation.
Our development team is continually working to solve these issues. In the meantime, you can use Experiment Requirements and initial instructions to screen out participants using affected devices/browsers.
Uploading audio and video recordings is demanding on a participant's connection. A higher level of technical attrition is often seen in experiments involving this functionality.
One potential sign that a participant might have had connection issues is the presence of multiple rows in their task data where the Response column contains BEGIN. This usually means the participant refreshed the browser during the task.
You might want to consider adding a connection speed requirement to experiments that involve recordings to mitigate this issue.
If a participant is using a VPN or an ad blocker, this can interfere with Gorilla contacting its servers and can cause disruption to recordings being uploaded. Instructing your participants to deactivate VPNs or ad blockers before participating in your study can help prevent this issue.
If you've tried all the above and recordings are still missing or won't play, contact our support team!
You've downloaded your data, but when you open one of the files, it's blank.
This usually means that no participants took part in this questionnaire/task in this version of your experiment.
You can check this on the CONSORT diagram on the Data tab of your experiment. Select the relevant experiment version, then look at the number next to the last arrow on the node whose file you're looking at. In the example below, 0 participants exited the node, meaning we will not see data from any participants in the file for this node when we download data for this experiment version:
It could be that participants did pass through this node in another version of your experiment. To ensure data from all experiment versions is included in your data download, click 'Download Experiment Data' and check 'Combine data from all other versions of this experiment into the data file(s)':
If you then click 'Regenerate Data' and download the resulting files, you should see all your data included.
If you've tried this and are still getting blank data files, contact our support team!
You're trying to use the Task Builder 2 Scripting Tools to add custom functionality to your task, but your script isn't working.
The first thing to be aware of is that scripts written for Task Builder 1 will not work in the scripting tab of Task Builder 2. Check out the Task Builder 2 Scripting Guide for an overview of the changes.
If you've followed the Task Builder 2 scripting guide and your script still isn't working, try the following tips:
The Task Builder 2 scripting tools enable you to create new custom task components. Once created in the scripting tab, you can add these new components to the task via the Add Object/Component menu. You can then bind the component's settings to stimuli/spreadsheet/the Store, just as you can for existing components.
This means each Task Builder 2 script must follow a specific required structure, containing many essential parts that are necessary for the script to function properly and show up as an addable component.
To make it easier to create a script that has all the essential parts, we've made templates available for common use cases - selecting one of these templates when you create your script minimises the chance of missing something out:
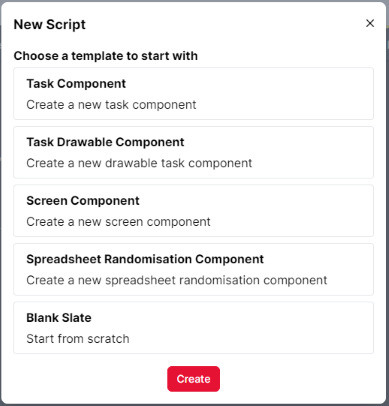
We've also provided a library of sample scripts and associated walkthroughs - consult these for help with fleshing out the template into a script that works for your use case.
Debugging is essential when trying to figure out why a script isn't working - consult our debugging guide for tips and links to helpful resources.
While we are not able to offer support with custom scripting, you're welcome to contact the support desk if there's information missing from our scripting guides.