Gorilla's Experiment Builder tool is unique in the world of online study building, as it provides a visual interface for constructing your participants' journey through your study, allowing you to implement counterbalancing, randomisation, redirects to external sites, and more. As a core part of Gorilla, and as part of our ongoing modernisation work on the backend of the platform, we thought it was high time the Experiment Builder received the same 2.0 treatment that Task Builder and Questionnaire Builder have had. However, we also didn't see the need for a whole new Experiment Builder tool.
That's why the new look Experiment Builder isn't a new tool, it's the existing Experiment Builder that you're used to but with a fresh user interface (UI), better performance, and more user friendly guidance.
To try out the new interface, click the blue 'Try Beta' button at the top-right of the Experiment Builder:

In 2024 we released the beta version of the Design and Data tabs, an upgrade to your existing experiments that will make it easier to build both simple and complex studies. From any experiment, you can try the new Design/Data tabs and explore the new features and capabilities. Any changes you make will be recorded and available in the original tabs, and you can switch back and forth between the new and classic views as much as you like.
You'll also find a Feedback button in the lower right of the canvas - please do use this (as many times as you wish!), as every bit of feedback helps us improve.
Browse the list of topics in the menu for more on what's changed!
Users with large, complex experiment trees found the Design tab would become slow to load and interact with (or sometimes stop working altogether!). We've completely rebuilt how we draw the experiment tree so it should scale better with more nodes and an even larger experiment canvas. We've also reworked how a lot of actions on the Design tab load and run, so the experiment canvas needs to refresh much less frequently.
You asked - and we did! The top requested feature on our roadmap was for the ability to zoom in and out of the experiment canvas, and at long last the changes we mention above also allowed us to implement this in the new look Experiment Builder. See all of your experiment in a single screen and navigate with ease.
Tree nodes are more visually dynamic with a node's connections moving with them when you drag and drop. This makes it easier to see how nodes in the tree are connected together. You can also directly delete connections (hurrah!) rather than having to delete the whole node. When trying to make new connections, nodes that are available to connect to will automatically highlight.
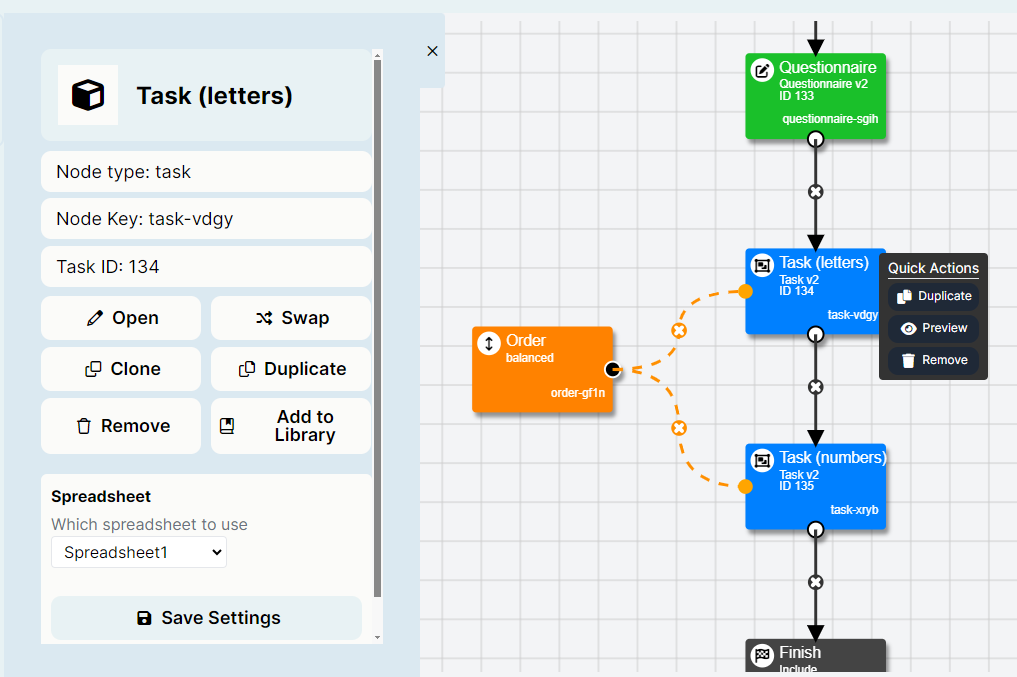
All nodes now have a right-click menu of Quick Actions, so the most frequently taken actions are fewer clicks away! More easily preview or remove individual nodes.
We've modernised the UI, making full use of wide screen devices (rather than limiting to a 4:3 window). We've also replaced almost all pop-up modals with a side menu, allowing you to perform most activities while still being able to view and interact with the experiment tree. We've also brought to the forefront some important, time saving tools like "Update Nodes" and "Check Errors" that were previously hidden behind other menus.
When creating or duplicating nodes, there were some nodes that required more steps than others and a few that would require you to first add them to the tree and then organise their settings. We've unified the experience now, creating a single flow for creating new nodes in the tree. All nodes share the same UI structure as well.
While our exceptional support team always love to hear from you, it's always more satisfying to get to the answer yourself. To help you find out what everything does, we've introduced a wealth of tooltips to the interface, covering everything from UI buttons to node settings. Some of these tooltips also include links out to the main support documentation site.
The Gorilla error checker can help you find and resolve some of the common issues that arise when building an experiment. We've pulled this out of the sub-menu it was in before and placed it on the main header, so it's easier to find. When Gorilla finds errors it will (as well as list them out) highlight them in the tree. Further, if you hover over them, the tooltip will have updated to list the errors present on this node.
The 'Update Nodes' button will help you automatically update all your nodes to the latest version (which is a common cause of previews not working as expected within experiments). We've pulled this out of the sub-menu it was in before and placed it on the main header, so it's easier to find. Further, Gorilla will also check for uncommitted changes on a task/questionnaire and warn you that these changes won't be available until you commit the task/questionnaire.
The update to the Data tab will mostly focus on bringing across the new look, with a few quality of life updates.
You'll now see handy tooltips on data generation settings and header text detailing how many participants you should expect to download on the current experiment version. You'll also see the newly launched Data Hamster options allowing you to combine data across tasks, questionnaires, and/or experiment versions.
To make it easier to get to grips with the new layout, this page will give you all you need to know about where to find the settings you're used to in the new look Experiment Builder. To try out the new interface, click the blue 'Try Beta' button at the top-right of the Experiment Builder:

Most aspects of the builder are in similar places to where they used to be. For example, the Preview, Version History, Cancel, Commit, Update Nodes and Check Errors buttons are still in the top right of the builder.
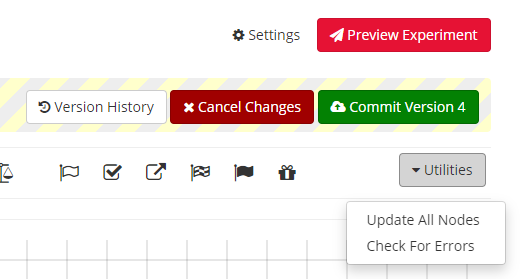
One key difference is that we've pulled some of those actions out into an extended header so that you can more easily access the buttons that are needed the most.

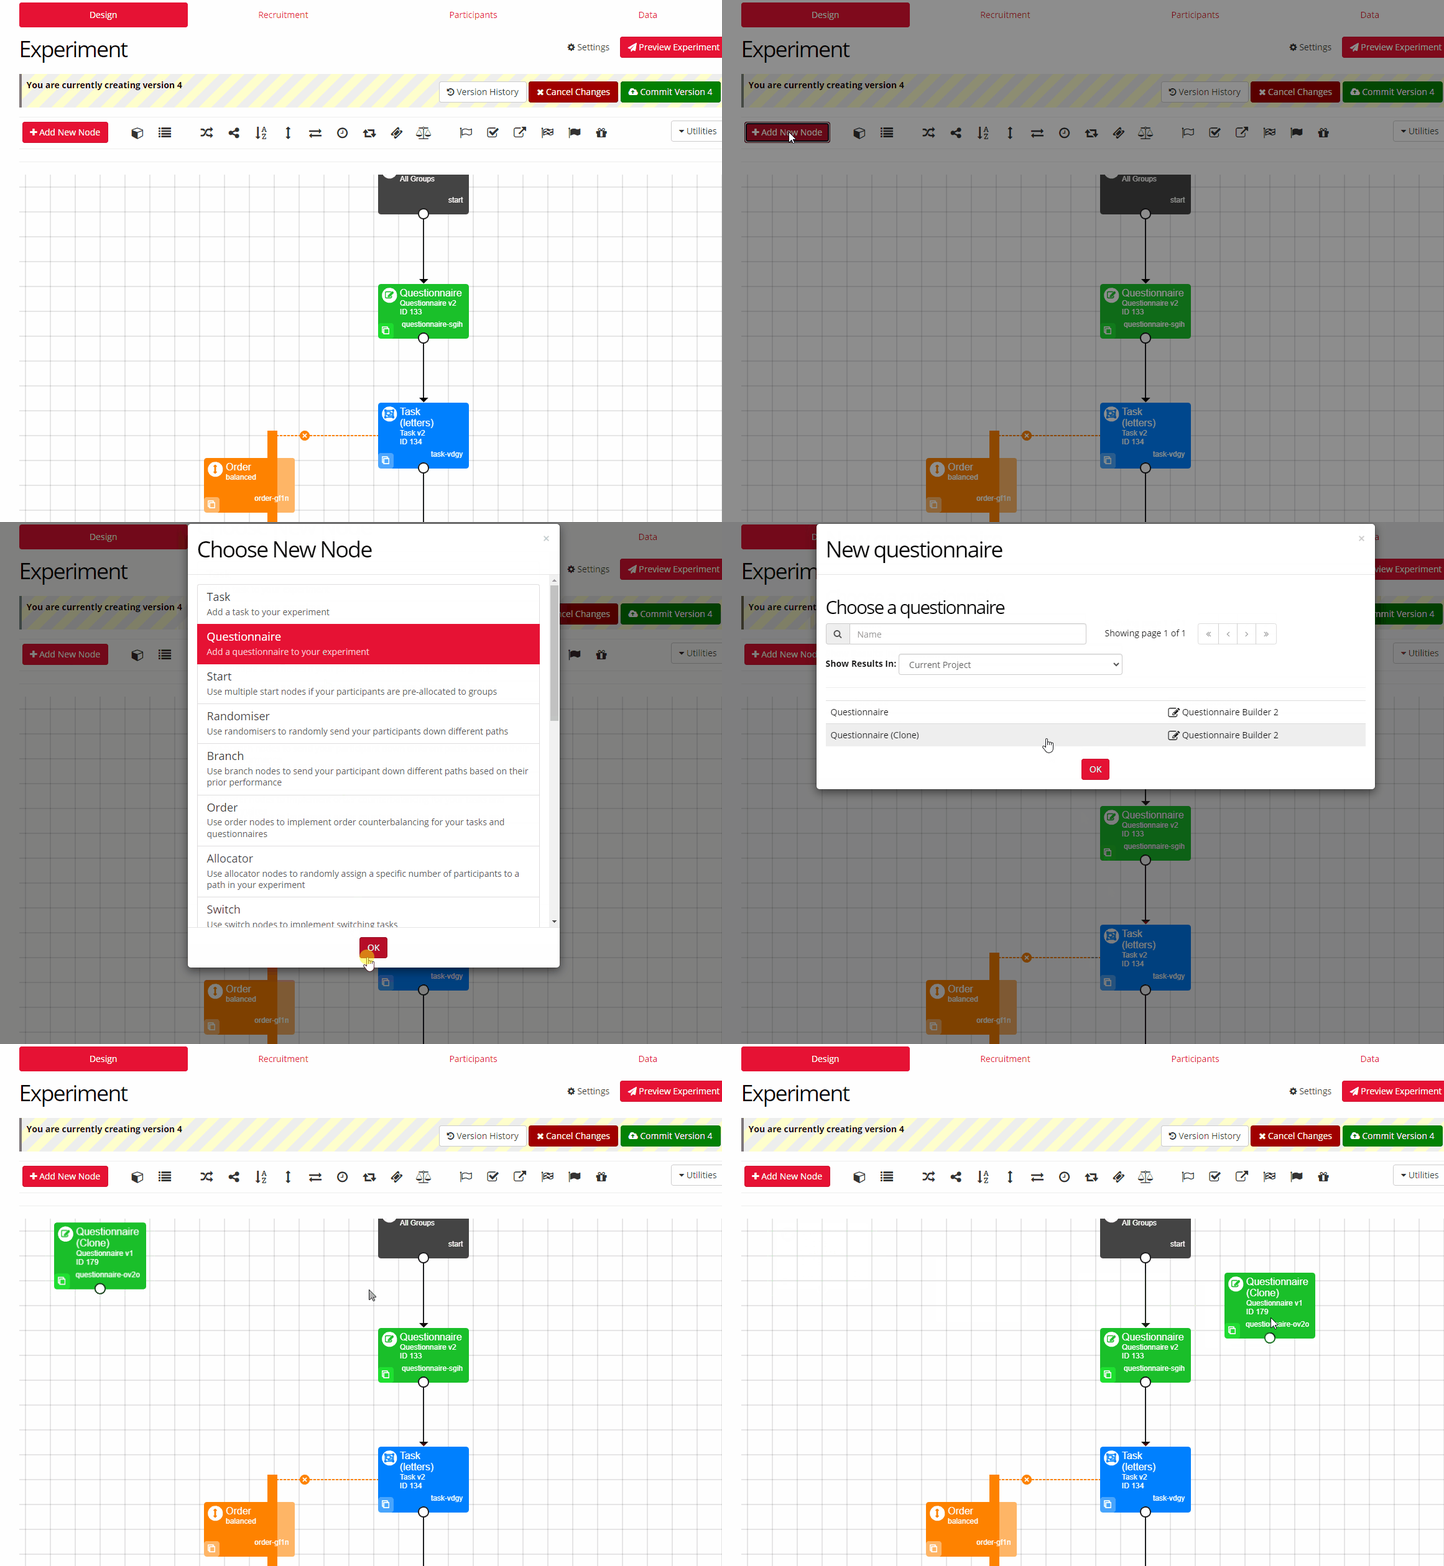
In the classic version of the builder you could choose a node type from the toolbar above the canvas or select 'Add New Node' - they did the same thing.
Once you've chosen the node you want, it would automatically place itself on the tree (not necessarily where you wanted it, and occasionally out of view!).
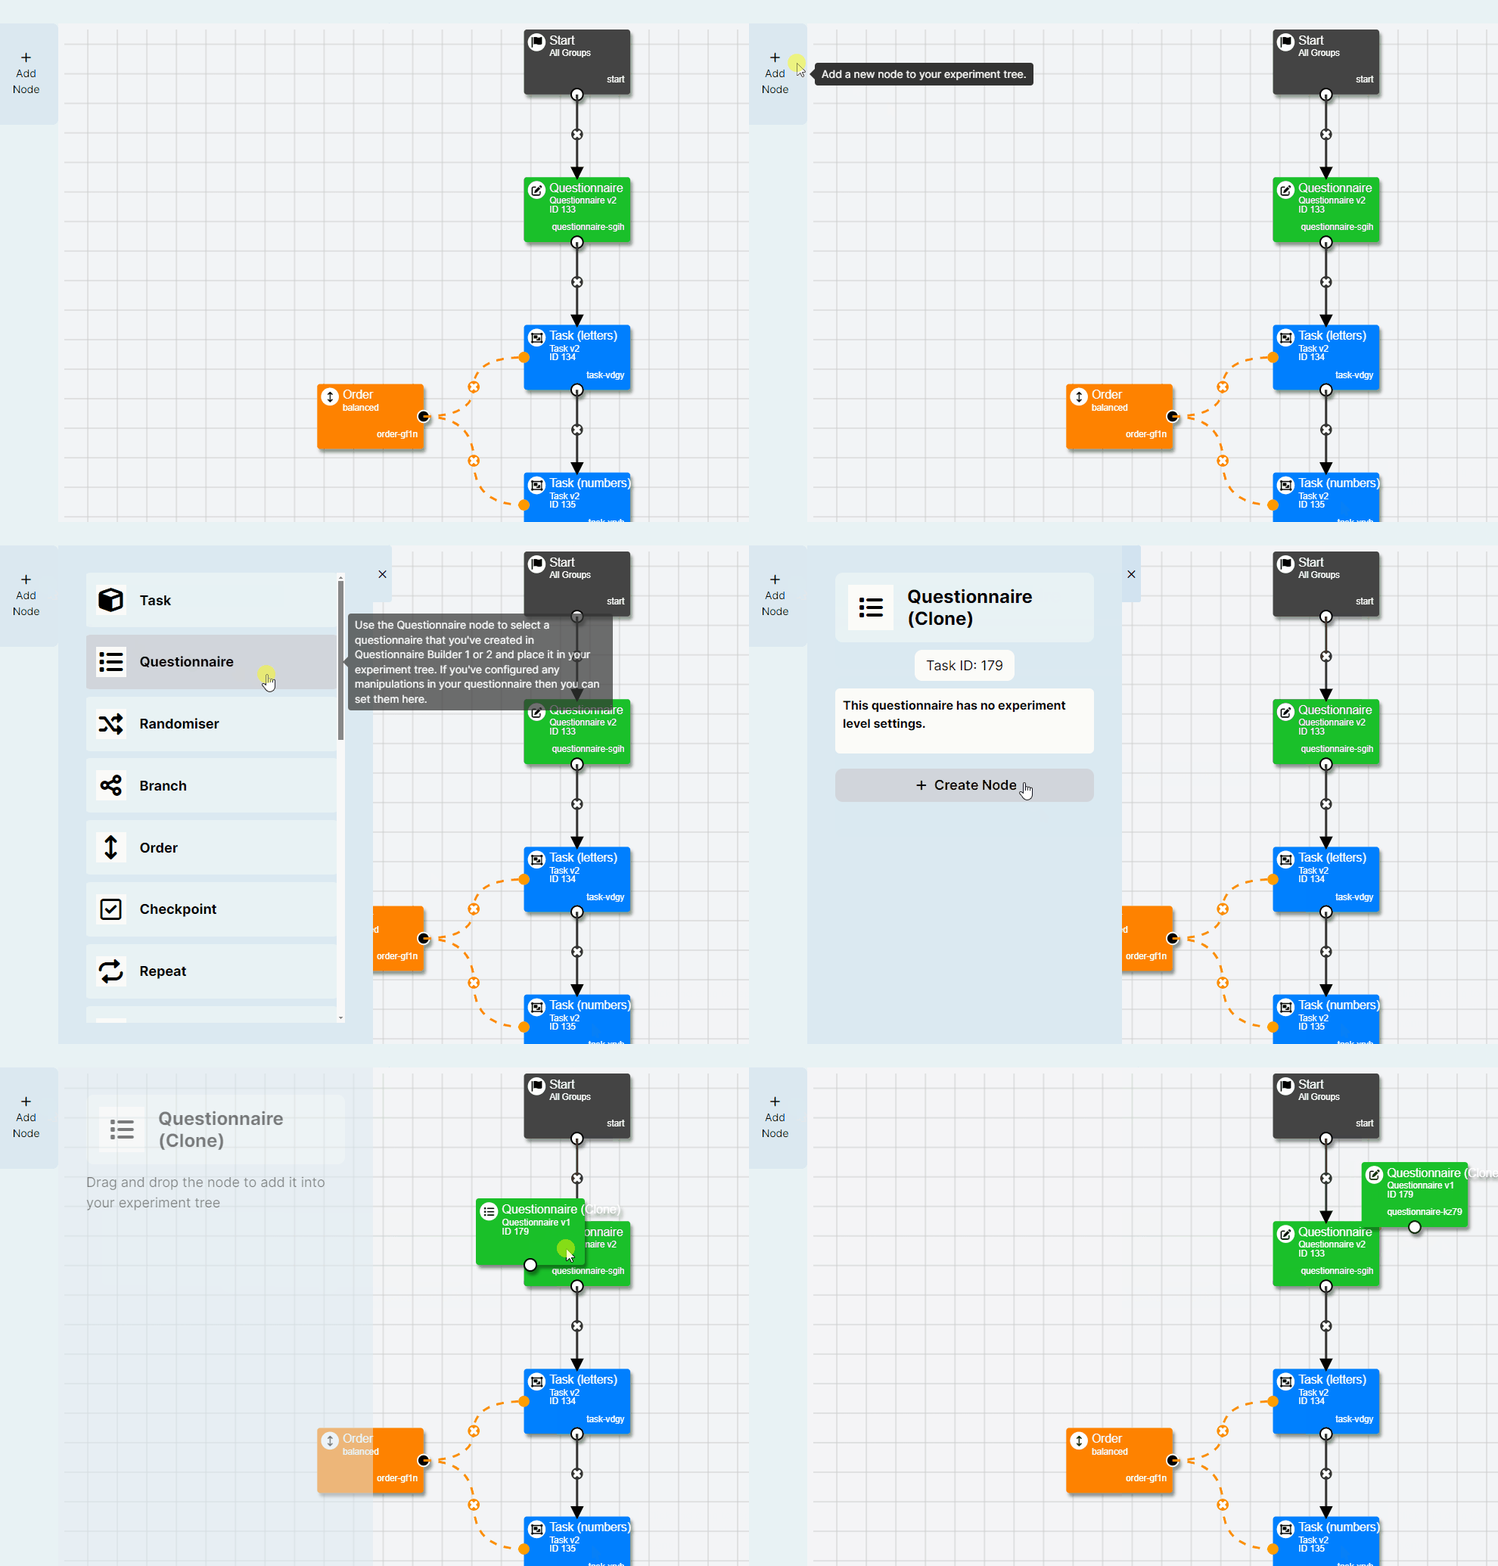
In the new look builder, it's one continuous journey. You add nodes from the left hand button, select your node type, apply any relevant settings that the node might need, and then you place it onto the tree wherever you choose.
The whole time, you can see and interact with the experiment tree.
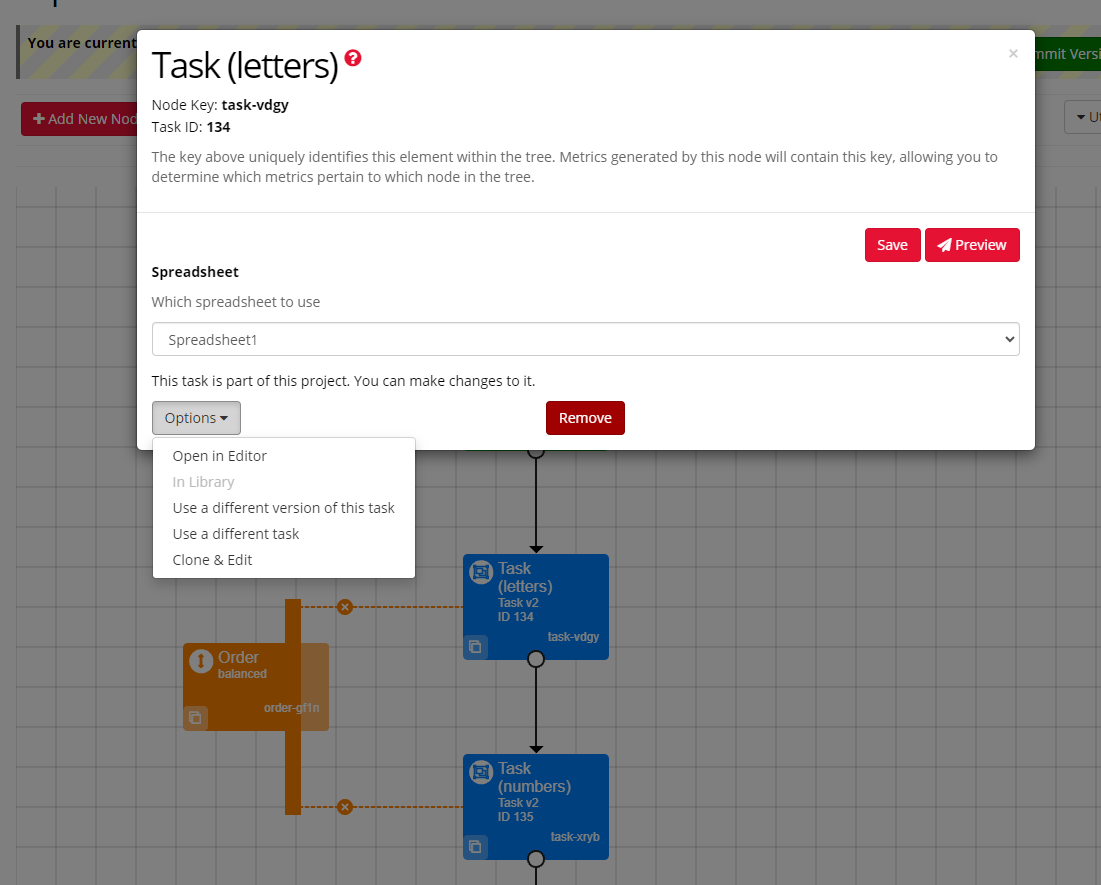
In the classic version of the builder you'd need to click on the node to bring up its settings, obscuring your view of the overall experiment tree. From the pop-up modal, you could take edit its settings or perform a series of actions such as previewing, cloning, or swapping the questionnaire/task for a different one.
In the new look builder, clicking the node brings up a side panel with all your settings in one place, which allows you to still see and interact with the experiment tree. For faster actions, such as previewing a specific node, you can simply right click on the node.
To make it easier to get to grips with the new layout, this page will give you all you need to know about where to find the settings you're used to in the new look Experiment Builder. To try out the new interface, click the blue 'Try Beta' button at the top-right of the screen:

The core functionality of the Data Tab is the same as before. Some buttons have changed their names and/or colours, but what they do is unchanged:
All these buttons are still located at the top-right of the Data tab, as shown in the following screenshot. At the top-left, you can also see at a glance how many participants are included in the currently selected version and in other versions, rather than having to go to the Participants tab for this information.
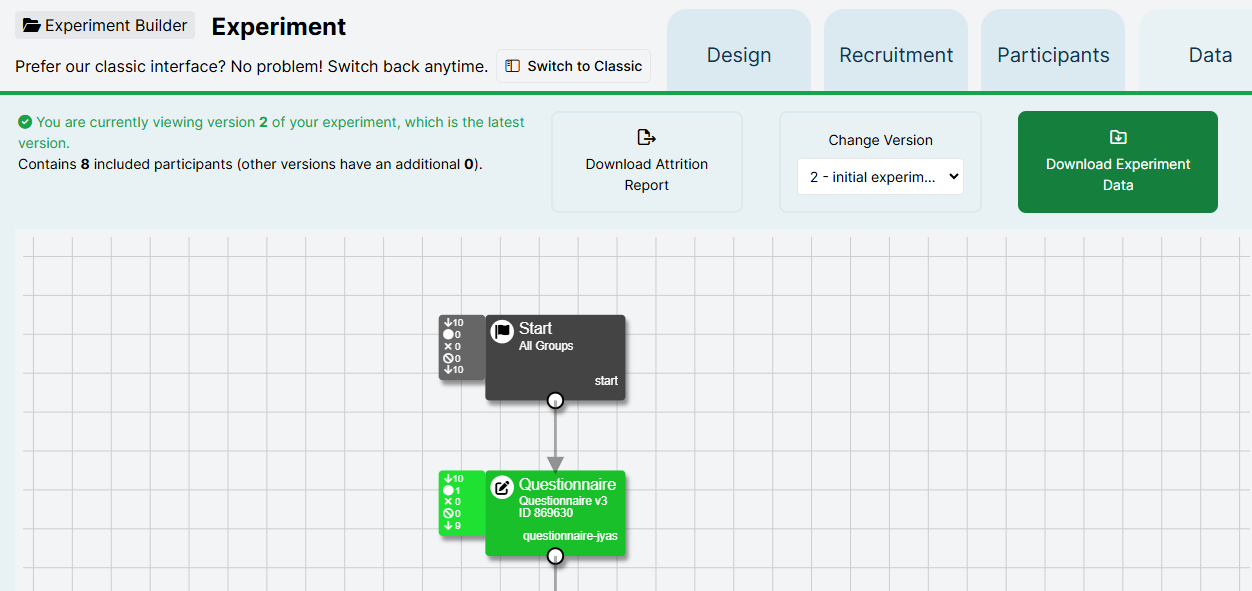
The other main change is that when you click Download Experiment Data or click an individual node, the data-download menu will pop out in a side panel instead of hiding your view of the experiment tree - so you can still navigate!