Debugging Guide: Developer Tools
Overview
Even the best programmers make mistakes and sometimes those mistakes can be difficult to track down. When using Gorilla's code editor, you can take advantage of tools already built-in to your browser to debug your code and track down those breaking problems.
Browse the list of topics in the menu for an introduction to using the debugging tools available in Chrome. Similar tools exist for other browser such as Firefox, Edge and Safari.
Note: In the Code Editor you may see the error message "Accessors are only available when targeting ECMAScript 5 and higher". This error message is a known issue that we're hoping to fix in the future. However, they are just compiler complaints and everything should still work correctly! You can safely ignore this error message.
Debugging Code in Chrome
The first step is to open the Chrome Browser from here, there are three routes for accessing the debugging tools in Chrome.
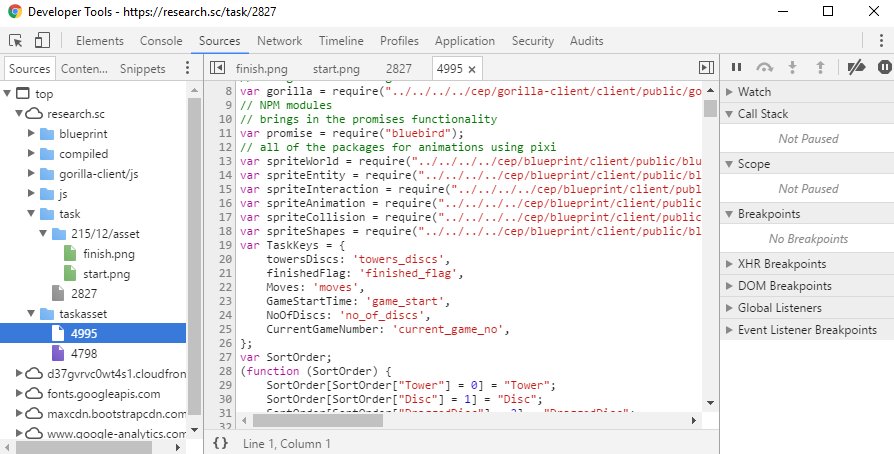
- The easiest route is to right click the page currently running your task and select 'inspect element.' This will open a window similar to the one below.
- Alternatively go to the customise and controls button (denoted by the three vertical ellipses to the right of the address bar and select 'More Tools' -> 'Developer Tools'.
- Or use the keyboard shortcut Ctrl+Shift+I for Windows or Cmd+Opt+I for Mac.
The Debugging Panels
Along the top of the debugging window, there are a selection of tools and panels which allow you to explore your code and how it is operating in your browser.
The debugging tools can either be docked to the side or bottom of your page, or they can be opened as a seperate window. To change this, within the dev tools box or window, select the customize and controls button and change the 'dock side'.
Device Mode
The chrome debugging tool allows you to simulate the screen size and resolution of different desktop screens, mobile devices and tablets. Select the toggle device icon (or use the keyboard shortcut Ctrl + Shift + M). This will then alter your currently open window.
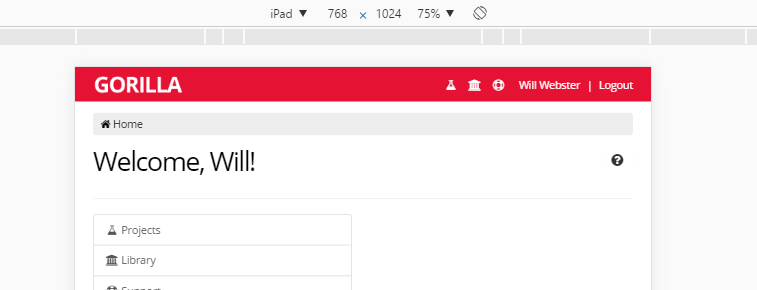
At the top of your screen, you will now have the option to select a range of common tablets or mobile devices and can also select a custom resolution and rotation.
Elements
The elements panel allows you to explore the content displayed on the page. You can navigate through the HTML you have set up in your templates and see how that relates to what you see on the screen.
Console
The console panel will display any content that you have requested via commands in your code using, for example, console.log. It will also display any errors that your code or Gorilla have picked up - the console is good place to start when debugging.
Sources
The sources panel collates the code files and other resources that are loaded when you run your task. As well as any code you have written yourself, this will include some files within Gorilla that are used to power tasks written with the code editor. You can insert breakpoints in the code where you want to pause execution, to check that the commands are functioning as intended, or to track down the origin point for errors.
Network
The network panel lists the files used by your task, how long they have taken to load and in what order. Use this to track down performance issues and improve the speed in which your task loads and runs. Note that you can also artificially 'throttle' your connection speed, to simulate people using your task over slower internet connections.
Learn more about debugging in Chrome
There is much more you can do with the Chrome debugging tools than is listed here. To learn more, check out Google's full documentation here.