The spreadsheet is at the heart of every Gorilla task. It's where you set up the flow of your task and define the content you want to show on each trial.
Using the spreadsheet, you can set up a few task displays and reuse them to create as many trials as you need, changing the stimuli, response options, and correct answers each time.
Follow the sections of this walkthrough to learn how!
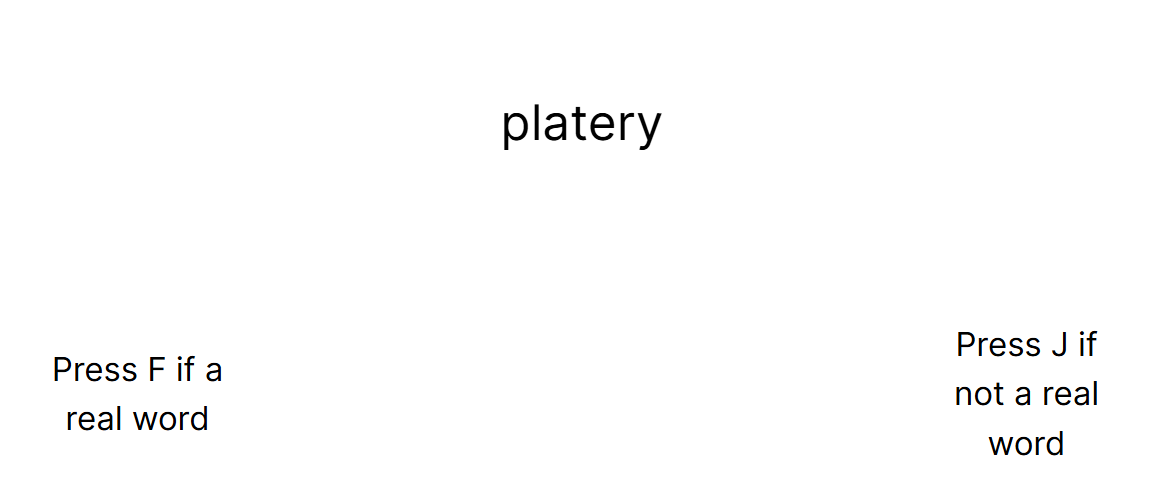
We start with a simple lexical decision task. On each trial, the participant sees a word. They have to press F if it's a real word in English, or J if it's not a real word in English.
In the task, we want to show the participant:
Here's how that looks in the spreadsheet:
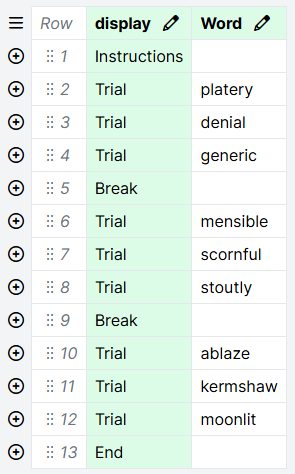
Each unique value in the Display column (Instructions, Trial, Break, End) is a display we have set up in the Displays tab.
Here is the Displays tab for the same task:
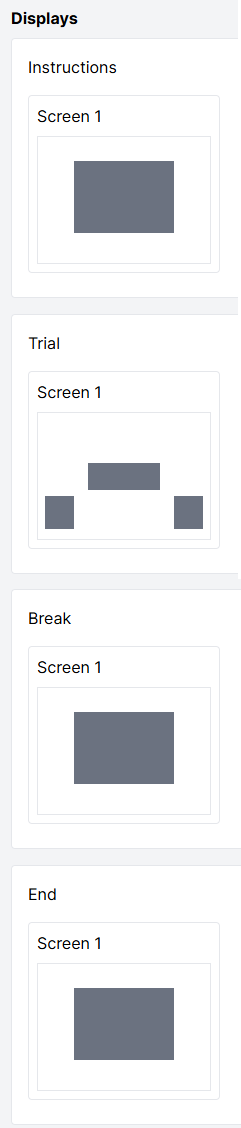
The Instructions and End displays are each used once, at the beginning and the end. The Break display is used twice. And the Trial display is used nine times to create our nine trials.
Here's an animation showing how the spreadsheet and displays work together to create the flow of the task:
The word we want to show on each trial is given in the Word column. On the Trial display, we need to tell Gorilla how to pull in this information from the spreadsheet to use on each trial.
To do this, we go to the Trial display and click on the object that corresponds to our stimulus (here, a Markdown Text object). Click the binding icon to the right of the Raw Text setting, select the spreadsheet column Word, and click Bind:
The green 'S' indicates that this setting is now bound to the spreadsheet - i.e. it will pull through the appropriate word for this trial from the Word column.
When we preview the task, we now see the full sequence of trials as specified in the spreadsheet, with a different word on each trial:
Take a closer look at this example and clone it into your own projects: Changing Stimuli
Next: Changing Response Options
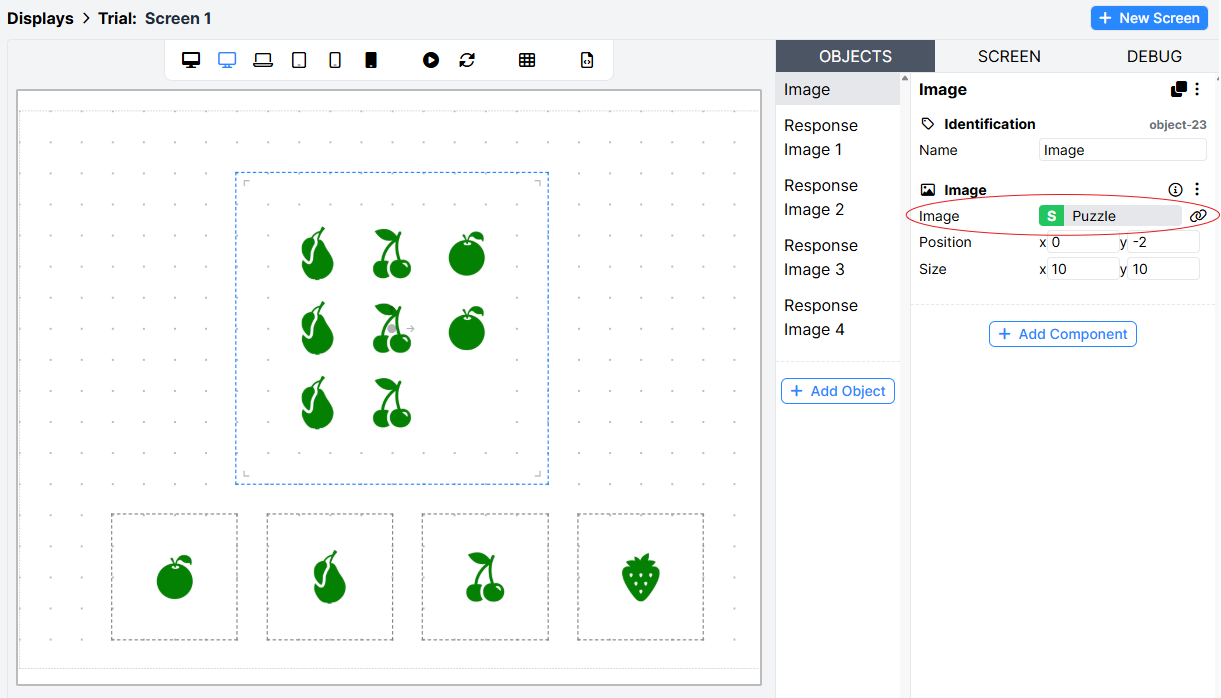
This time, we're going to use a simple relational reasoning task. On each trial, the participant sees a 'puzzle' image and four possible response images. The participant must click the image that corresponds to the missing piece of the puzzle.
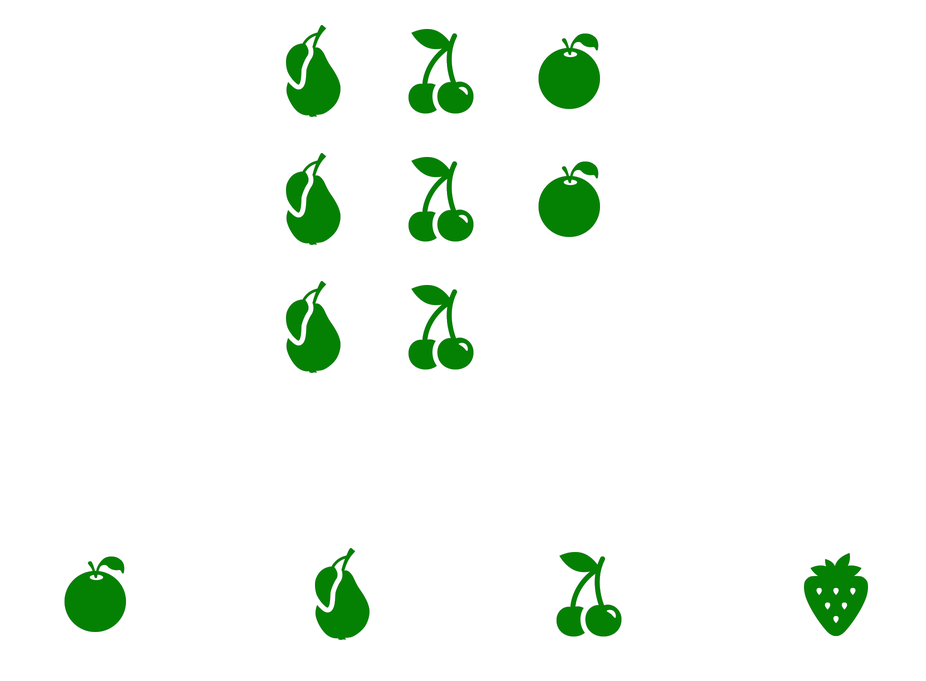
In the task, we want to show the participant:
Here's how that looks in the spreadsheet:
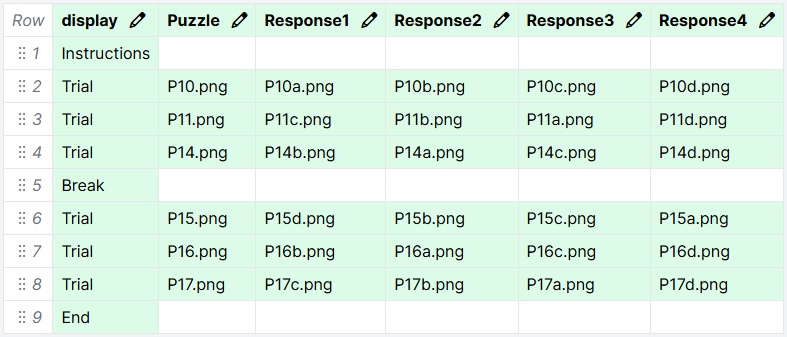
As in the Changing Stimuli example, the display column contains the Display we want to show at each time step in the task. The Puzzle, Response1, Response2, Response3, and Response4 columns contain the filenames of the images we want to show as stimuli and response options on each trial.
To get these images to show up on each trial, there are two more steps we need to take.
Any images we want to show in our task need to be uploaded to the Stimuli tab of the task. To do this, click Stimuli on the left sidebar and then 'Add Stimuli':
Just like in the Changing Stimuli example, we use the binding icon to tell Gorilla to look in the spreadsheet to find what images to show on each trial.
For the main puzzle image, we just need to bind the Image setting of the Image component to the spreadsheet column 'Puzzle':
For each of the response options 1-4, there are two settings we need to bind to the relevant column in the spreadsheet: 1) the Image setting of the Image component, and 2) the Response setting of the Click Response component:
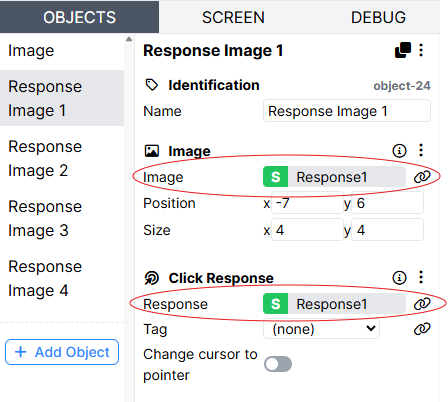
This is because we want to change two things simultaneously from trial to trial: which image is shown on each response button, and what response is recorded when the participant clicks it.
The setup above will record the filename of the clicked image as the participant's response in your data:

What this setup will not do (yet!) is automatically record whether the participant's response on each trial was correct or incorrect. To find out how to do this, see the next example.
Take a closer look at this example and clone it into your own projects: Changing Response Options
Next: Changing Correct Answers
To demonstrate changing the correct answer from trial to trial, we'll use a Naming Task.
On each trial, the participant sees a fixation cross, then a picture of an animal. The participant enters the name of the animal in a box and clicks Submit.

Here's what the Trial display looks like in this task:
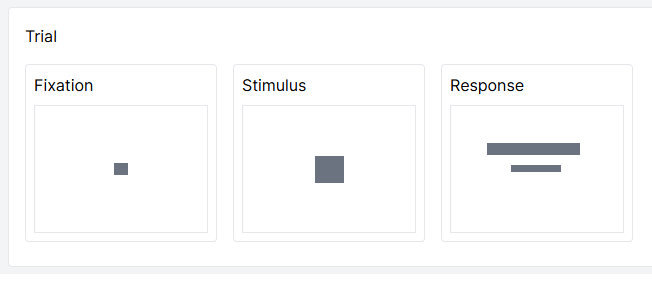
The display is made up of 3 screens (Fixation, Stimulus, and Response).
Whenever you list a display in the spreadsheet, the full sequence of screens in that display will be shown (unless you intentionally skip some using screen branching). This means we can reuse a whole sequence of screens to create a series of multi-screen trials.
Here's an animation showing how the spreadsheet, screens, and displays work together to create the flow of the task:
In the task, we want to show the participant:
Here's how that looks in the spreadsheet:
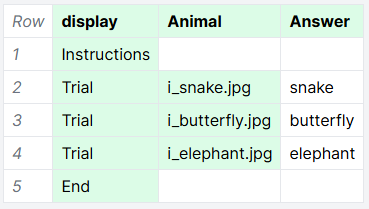
As always, the display column contains the Display we want to show at each time step in the task.
The Animal column contains the filenames of the images we want to show as stimuli on each trial. As in the Changing Response Options example, we have uploaded these files to the Stimuli tab.
The Answer column contains the correct answer for each trial. To score the answers as correct or incorrect, there are two more steps we need to take.
On any screen where participants give a response that you want to mark as correct or incorrect, add a Scorer component to the Screen tab.
In this task, we add a Scorer component to the Response screen of both the Practice and the Trial displays.
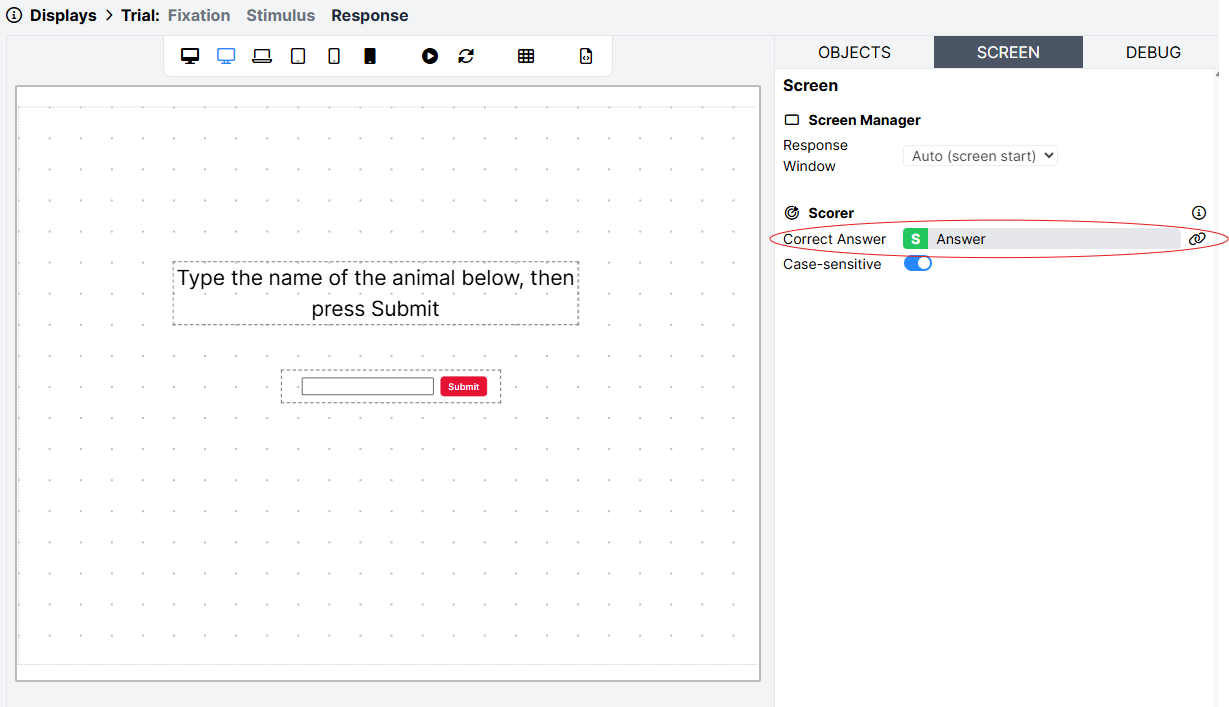
Just as we use the binding button in the Image component to tell Gorilla what image to show on each trial, we also use it in the Scorer component to tell Gorilla what the correct answer is on each trial.
We bind the Correct Answer setting of the Scorer component to the spreadsheet column 'Answer':
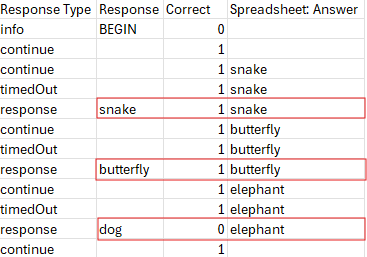
Now this has been set up, the Correct column of the data file will contain a 1 on trials where the participant's answer matches the value in the Answer column, and a 0 on trials where it does not.
Take a closer look at this example and clone it into your own projects: Changing Correct Answers
The spreadsheet isn't just for managing the flow of your Gorilla task. Every column in your spreadsheet is also included in your participant data. This means you can use your spreadsheet to keep track of key information about your trials, making your data analysis easier!
To demonstrate, we'll use a simple Thatcher Task. On each trial, the participant sees an image of a face and has to judge if it is real or not real.
The trials vary the orientation of the face (upright or inverted). Separately, they also vary whether the face is real (orientation of the eyes matches the orientation of the face) or not real (orientation of the eyes does not match the orientation of the face).
The information on whether the face is real or not real is used directly in the task. As in the Changing Correct Answers example, a Scorer component on the Screen tab of the response screen is bound to the Answer column of the spreadsheet:

The information on the orientation of the face is not used directly in the task. However, it's important to the analysis of the data, since we expect participants to be slower and less accurate when the face is inverted.
To make our data analysis easier, we include the orientation information as a metadata column in the spreadsheet:

When we download data from the task, this column will be included as the column 'Spreadsheet: Orientation', enabling us to easily identify trials by their type for our analysis:

We can then use this column in a pivot table or pivot chart to easily show the average accuracy for each trial type:
For guidance on making pivot tables, see our Data Analysis guides.
Take a closer look at this example and clone it into your own projects: Adding Trial Metadata
That's all for this walkthrough! For more in-depth information on binding to the spreadsheet, see our How To Guide.
If you've got the hang of the spreadsheet, check out our Randomisation Walkthrough to learn how to randomise the order of your trials, your blocks, your response options, and more!