This guide describes how to access your participant data from your experiment. Check out the topics in the menu for guidance on each step.
For guidance on how to analyse your data once you've downloaded it, check out our Data Analysis Guide.
Before you can download your data, you first need to generate it. Data can be generated from the Data tab in the Experiment Builder.
To generate all your data, click the Download Experiment Data button. To generate data from a specific task or questionnaire, click the task or questionnaire node in the experiment tree in the Data tab.
In both cases, you will then see the data generation options:
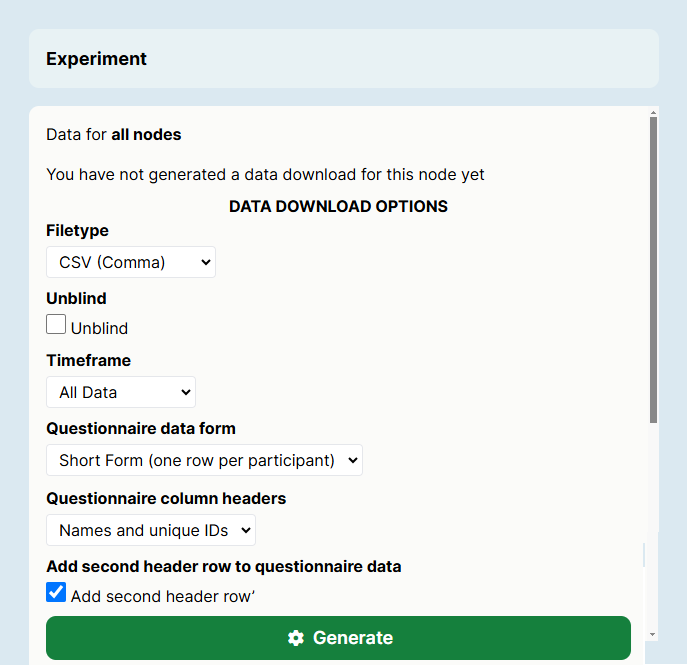
This screenshot shows the new Experiment Builder interface. If you’re still using the classic interface, it will appear slightly different.
First, decide how you want to combine your data. By default, Gorilla will generate a separate file for each node, for the currently selected version of your experiment only. Use the checkboxes to optionally combine data across versions, across multiple tasks, and/or across multiple questionnaires.
Select what file type you’d like your data to be downloaded in: XLSX or CSV (comma, semicolon or tab delineated).
You have the option to unblind your data, which displays Public IDs along with Private IDs in your data, meaning that your participants could potentially be identified.
You can also select the timeframe of data you’d like to download: all data, from today, from the last five days, or from a custom time period.
Task data will be generated in Long-Format (one row per trial). For Questionnaire data, you have the option to download data in either Long-Form or Short-Format (one row per participant). If you have chosen to combine data from multiple questionnaires into one short-form data file, you'll see multiple rows per participant, with each row of data corresponding to one questionnaire in your experiment. Check out our guide to Data Format for more information, and follow our walkthrough on how to clean and transform your data into Short-Form using R.
Scores calculated in the Scoring tab in Questionnaire Builder 2 are included in both short-form and long-form data. However, other data from the Store in Questionnaire Builder 2, and from the Script widget in Questionnaire Builder 1, are not included in short-form data. If you want to include other Store data, or any data from a script widget, download the long-form version.
If you select short form data, you can also choose whether you want your column headers to use the name and the unique ID of the associated questionnaire object (to guarantee uniqueness) or just the object name (if you have already given your questionnaire objects unique names). You can also optionally choose to add a second header row to your questionnaire data containing the full text of each question.
If you select long form data, you can choose to include additional questionnaire metrics. If this box is ticked, your questionnaire data will include detailed information on participants' interactions with your questionnaire, such as whether they went back to a previous page and changed their answers. See our guide to understanding your data for more information and examples.
Once you are happy with the options you have selected, click Generate. Generating data does not affect your tokens, and you can generate your data an unlimited number of times.
This screenshot shows the new Experiment Builder interface. If you’re still using the classic interface, it will appear slightly different.
If your data takes longer than 24 hours to generate, please Contact Us! Once your data has generated, you can then download your data.
Once your data has successfully generated, you will see a 'Download Data' button on the Download Experiment Data window:
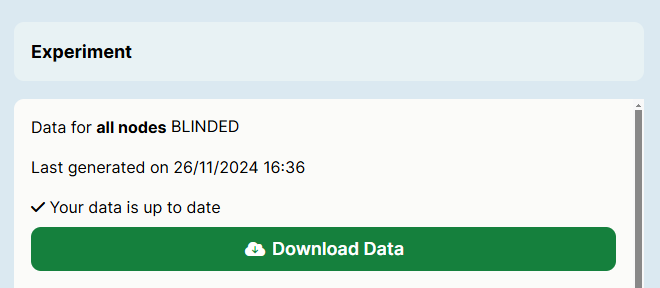
This screenshot shows the new Experiment Builder interface. If you’re still using the classic interface, it will appear slightly different.
Click Download Data to download your data.
Large data sets
By default, Gorilla will zip your data files into a single archive for you to download. However, for large data sets, this can cause the generation process to stall. To prevent this, Gorilla will not create a zip archive for datasets that exceed a given size. Instead, a 'Download All Files' button will appear, allowing you to download all files with a single click:
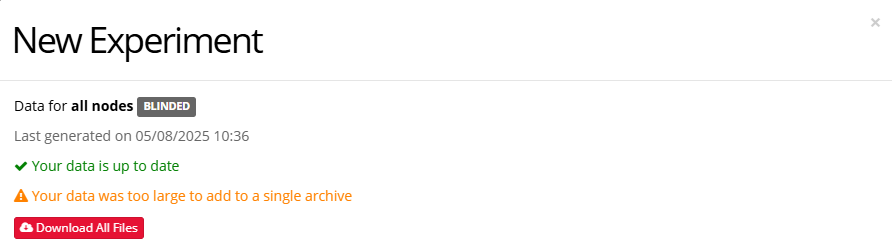
(This screenshot shows the new Experiment Builder interface. If you’re still using the classic interface, it will appear slightly different.)
If your data file is blank, check on the Participants tab that participants have completed the version you’ve downloaded data for, and that any incomplete participants whose data you want to download have been included.
To regenerate your data with different settings, scroll down past the Download Data button, select your preferred settings, and click Regenerate Data.
If you have collected new participants since the last time you downloaded your data, you will need to generate your data before downloading it.
To find out how to understand and analyse your data, check out our Gorilla data analysis guide.
If you experience any issues downloading your data, contact our support team.
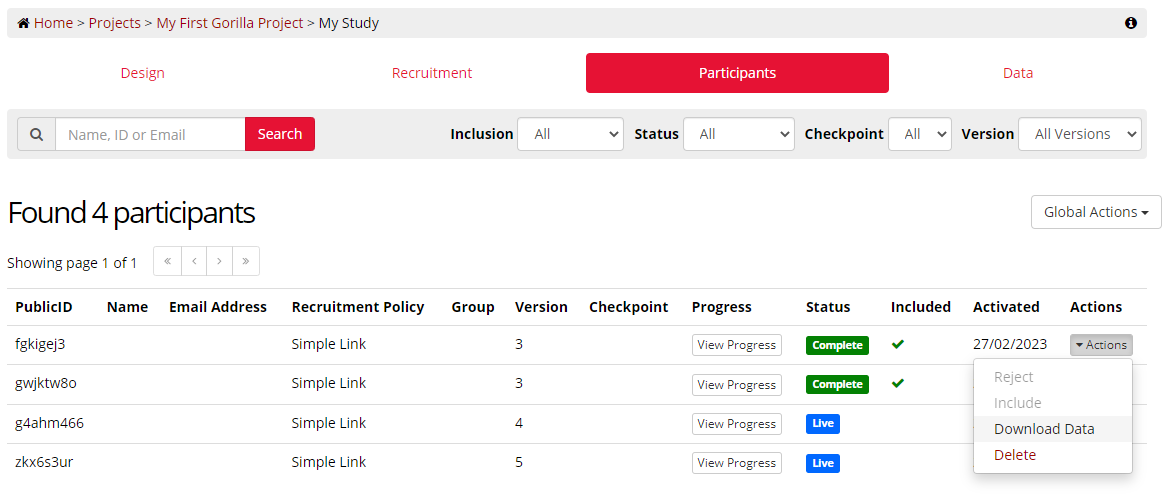
If you wish to download the data from a specific participant, you can do this via the Participants Tab. To access all data from all participants, see the generating data section of this guide.
To download the data from a single participant, navigate to the Participants Tab of the Experiment Builder, and click the Actions button, and select 'Download Data'. You can only download the data from participants that have Completed the experiment, or have been manually included in the dataset.
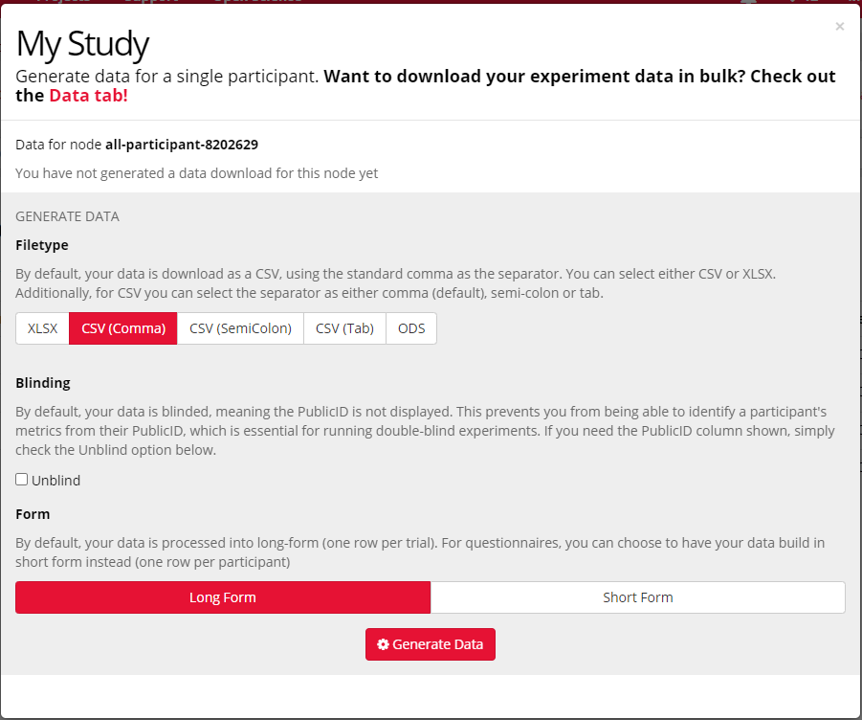
Once you click Download Data, you will be able to choose the format and filetype of the data, and whether you would like to Unblind the data.
While you can combine data from tasks into a single file, and data from questionnaires into a single file, Gorilla cannot automatically aggregate task and questionnaire data into one file.
We have a couple of guides to help you combine data across tasks and questionnaires. We have created an R Studio walkthrough and a video guide in Excel which provide more details on how to combine data across tasks and questionnaires.
Everything you need to know about understanding your data can be found in our Data Analysis guide.
Check it out to understand: