Navigate through the menu for information on how to understand your eye tracking data, prepare it for analysis and see answers to most commonly asked questions.
Detailed instructions on how to set up the Eye Tracking (Webgazer) component in Task Builder 2, including tips for successful calibration, are available in our Task Builder 2 Components Guide.
See our Visual World Paradigm (Eye Tracking) sample to try out the component and view an example setup.
When you download your data, you will (as standard on Gorilla) receive one data file which will contain all of your task metrics for all of your participants. This will contain summarised eye-tracking data.
For each time the participant attempted calibration, the Response column will contain information on whether calibration failed or succeeded.
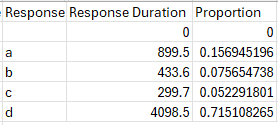
For each eye tracking data collection screen, you will receive information on the absolute and proportional time participants spent looking at each quadrant of the screen. Screen quadrants are represented in the Response column by the letters a, b, c and d (where a = top-left, b = top-right, c = bottom-left, and d = bottom-right). The time in milliseconds that the participant spent looking at each quadrant is shown in the Response Duration column, and the proportion of total screen time the participant spent looking at each quadrant is shown in the Proportion column. The screenshot below shows an example (some rows and columns have been hidden for clarity):

For many experiments, this will be the only eye tracking data you need.
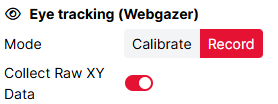
By default, you will also receive the full coordinate data for the eye tracking component. You can control whether or not to collect this data using the 'Collect Raw XY Data' toggle in the Eye Tracking component settings. By default, it will be toggled on, as shown below.

You will receive the full eye-tracking data in separate files, one file per screen. When previewing a task, you can access the detailed eye-tracking files via a unique URL for each screen that will be contained in the Response column of your main data file. When running a full experiment, you will find these files in an 'uploads' folder included in your data zip file.
For guidance on interpreting and processing the data, see the Analysis section of this guide.
Once you have your detailed eye tracking data, this section describes the relevant column variables you need to look at. Any column headings not defined below are standard Gorilla data columns described in the Data Columns guide.
Within your detailed eye tracking data file, coordinates are given in two formats: raw and normalised.
Raw coordinates (Predicted Gaze X, Predicted Gaze Y) are in pixels. 0,0 is at the bottom-left of the screen. So a predicted gaze location of x = 50, y = 100 denotes a point 50 pixels from the left edge of the screen and 100 pixels from the bottom edge of the screen.
Because of variation between participants in screen and window sizes and display resolution, raw coordinates will not necessarily map onto the same visual content for different participants. Within-participant, you can still map gaze locations to AOIs by cross-referencing the predicted gaze coordinates with the Zone rows at the top of your detailed eye tracking data file. The Zone rows include the coordinates of the left and top edges of each object (or image/video, for media displayed within an Image or Video object) on the screen, plus their width and height. See 'Object locations' section below for more details.
Normalised coordinates (Predicted Gaze X Normalised, Predicted Gaze Y Normalised) are normalised to a value between 0 and 1. They represent the predicted gaze location as a proportion of the Gorilla stage, the 4:3 area in which Gorilla studies are presented. 0,0 is at the bottom-left of the stage, and 1,1 is at the top-right. Coordinates below 0 or above 1 therefore represent predicted gaze coordinates that fall outside the Gorilla stage, on other areas of the screen. Normalised coordinates are comparable between participants: for example, 0.5, 0.5 always denotes the centre of the stage.
We've created a mock-up image which should make this clearer (note: image not to scale). To work out the normalised X, we need to take into account the white space on the side of the Gorilla stage.
Object locations
At the top of your detailed eye tracking data file, you will find a number of rows with 'zone' in the Type column. These rows contain the locations of each object on the task screen. You can use these to determine which objects on the screen the participant was looking at.
For object locations, the key variables for each sample/row are:
Prediction rows
Below the 'zone' rows you will find a number of rows with 'prediction' in the Type column. Each of these rows represents Webgazer’s prediction of where the participant is looking on the screen. The eye tracking runs as fast as it can, up to the refresh rate of the monitor (normally 60Hz), so under ideal conditions you should get about 60 samples per second.
For predictions, the key variables for each sample/row are:
You can also choose to collect detailed eye tracking data for the Eye Tracking (Webgazer) component when used in Calibrate mode. The format of these files differs somewhat from the eyetracking recording files.
Rows containing 'calibration' in the Type column do not include gaze predictions, as these cannot be made until the eyetracker has been trained/calibrated. Rows containing 'validation' in the Type column include gaze predictions for a number of samples for each calibration point. Rows containing 'accuracy' in the Type column contain the validation information for each calibration point.
Once you have downloaded your eye tracking data in CSV format, making sure the timestamps are printed out in full, you can use the 'Type', 'Trial Number', 'Screen Index', and 'Timestamp' columns to filter data into a format usable with most eyetracking analysis toolboxes.
Using your preferred data processing tool (R, Python, Matlab etc), select rows containing ‘prediction’ in the 'Type' column, and then use 'Trial Number', 'Screen Index', and 'Timestamp' to separate each trial or timepoints of data capture.
The data produced by Webgazer and Gorilla works best for Area of Interest (AOI) type data analyses. This is where we pool samples into falling into different areas on the screen, and use this as an index of attention.
Due to the predictive nature of the models used for webcam eyetracking, the estimates can jump around quite a bit – this makes the standard fixation and saccade detection a challenge in lots of datasets.
Toolboxes for data analysis
Check out our Visual World Paradigm (Eye Tracking) sample to try the component out and see an example setup.
This is only available if 'Collect Raw XY Data' is toggled on in the Eye Tracking (Webgazer) component settings before starting to collect data - see the Data section of this guide.
When previewing a task, you can access the detailed eye-tracking files via a unique URL for each screen that will be contained in the Response column of your main data file. When running a full experiment, you will find these files in an 'uploads' folder included in your data zip file.
The Eye Tracking (Webgazer) component only allows you to calibrate the tracker once it has detected a face in the webcam. You may need to move hair off the eyes, come closer to the camera, or move around.
Eye tracking via the browser is much more sensitive to changes in environment/positioning than lab-based eye tracking. To increase the chances of successful calibration, instruct your participants to ensure they are in a well-lit environment, to ensure that just one face is present in the central box on the screen, and to avoid moving their head during the calibration. You can also adjust the calibration settings to make the calibration criteria less stringent (although note that this may result in noisier and less reliable data).
Yes and No - but mostly No. The nature of Webgazer.js means that predictions will be a function of how well the eyes are detected, and how good the calibration is. Inaccuracies in these can come from any number of sources (e.g. lighting, webcam, screen size, participant behaviour).
The poorer the predictions, the more random noise they include, and this stochasticity prevents standard approaches to detecting fixations, blinks and saccades. One option is to use spatio-temporal smoothing -- but you need to know how to implement this yourself.
In our experience less than 30% of your participants will give good enough data to detect these things.
You will get the best results by using a heatmap, or percentage occupancy of an area of interest type analysis. Open the expandable 'Are there any studies published using eye tracking in Gorilla?' below to see examples of the analyses done in previously published papers.
You can, however, there are two main issues here 1) the calibration stage requires the participant to look at a series of coloured dots, which would be a challenge with young children, and 2) getting children to keep their head still will be more difficult. If the child is old enough to follow the calibration it should work, but you will want to check your data carefully and you may want to limit the time you are using the eye tracking for.
We've created a mock-up image which should make this clearer (note: image not to scale). To work out the normalised X, we need to take into account the white space on the side of the Gorilla stage, the 4:3 area in which Gorilla studies are presented.
For object locations (rows at the top of your detailed eye tracking data file with 'zone' in the Type column), Zone X Normalised refers to the left edge of the object, and Zone Y Normalised refers to the top edge of the object. Zone W Normalised is the width of the zone in normalised space (i.e. as a proportion of the width of the stage). Zone H Normalised is the height of the zone in normalised space (i.e. as a proportion of the height of the stage).
Note that for Image or Video objects, the coordinates, width, and height refer to the image/video as displayed within the object, not the object itself.
The Analysis section of this guide provides explanations of the columns included in your eye tracking data. If you have a specific question about your data, you can get in touch with our support desk, but unfortunately we’re not able to provide extensive support for eye tracking data analysis. If you want to analyse the full coordinate eye tracking data, you should ensure you have the resources to conduct your analysis before you run your full experiment.
Some examples of published studies using eye tracking in Gorilla are listed below - please let us know if you have published or are writing up a manuscript!
Lira Calabrich, S., Oppenheim, G., & Jones, M. (2021). Episodic memory cues in the acquisition of novel visual-phonological associations: a webcam-based eyetracking study. In Proceedings of the Annual Meeting of the Cognitive Science Society (Vol. 43, pp. 2719-2725). https://escholarship.org/uc/item/76b3c54t
Greenaway, A. M., Nasuto, S., Ho, A., & Hwang, F. (2021). Is home-based webcam eye-tracking with older adults living with and without Alzheimer's disease feasible? Presented at ASSETS '21: The 23rd International ACM SIGACCESS Conference on Computers and Accessibility. https://doi.org/10.1145/3441852.3476565
Prystauka, Y., Altmann, G. T. M., & Rothman, J. (2023). Online eye tracking and real-time sentence processing: On opportunities and efficacy for capturing psycholinguistic effects of different magnitudes and diversity. Behavior Research Methods. https://doi.org/10.3758/s13428-023-02176-4
Geller, J., Prystauka, Y., Colby, S. E., & Drouin, J. R. (2025). Language without borders: A step-by-step guide to analyzing webcam eye-tracking data for L2 research. Research Methods in Applied Linguistics, 4(3), https://doi.org/10.1016/j.rmal.2025.100226.