You're viewing the support pages for our Legacy Tooling and, as such, the information may be outdated. Now is a great time to check out our new and improved tooling, and make the move to Questionnaire Builder 2 and Task Builder 2! Our updated onboarding webinar is a good place to start.
Embedded data is data about a participant's responses that you can store at one point in the experiment and access later on. Essentially, embedded data is information you can ’carry’ from one part of your task or questionnaire to others within the same experiment.
It can be used to:
Note: Embedded data does not appear in your downloadable metrics.
Check out the list of topics in the menu for more on how to use embedded data within your experiment.
You're viewing the support pages for our Legacy Tooling and, as such, the information may be outdated. Now is a great time to check out our new and improved tooling, and make the move to Questionnaire Builder 2 and Task Builder 2! Our updated onboarding webinar is a good place to start.
To store embedded data in the Questionnaire Builder, check the ‘Write to Embedded data’ option in the widget of your choice.
Note: This is not available for all widgets.
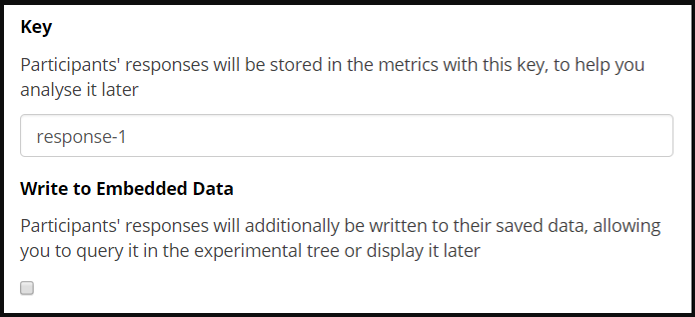
This will save the responses from this widget as embedded data, allowing you to retrieve it later in the experiment.
To Branch participants according to their answers, you would then need to configure a Branch Node in the Experiment Tree.
To store embedded data in the Task Builder, go to the Embedded data settings within the 'Active Responses' menu below the Screen Preview.
Note: This is not available for all zones.
Identify which of the options you'd like to store as embedded data, and enter in the setting a name for the embedded data e.g. 'correct'.
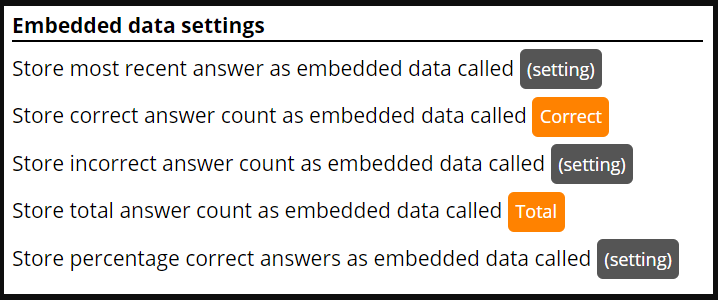
This will save the selected data under the name you have entered, allowing you to retrieve it later in the experiment.
In the example above, the embedded data are saved as Static content (orange), meaning correct and total counts will accumulate across all trials and all versions of the task. You can also save embedded data as Spreadsheet content (green), if you want to count correct/total separately for different groups of trials, or as Manipulation content (blue), if you want to count correct/total separately for different versions of a task. For more on the different ways of storing and retrieving embedded data in the Task Builder, see the videos later in this guide.
Note:
‘Store correct answer count’, ‘Store incorrect answer count’, ‘Store total answer count’ and ‘Store percentage correct answers’ require you to set a correct answer for each trial.
Remember: All names are case-sensitive
In the Questionnaire Builder, the embedded data can be accessed by using the key that was set for the response widget of interest. In the Task Builder, the embedded data can be accessed by using the name you entered in the embedded data settings.
When choosing a key or name, try to make it something unique and memorable.
A good way to make sure you are using the same word is to copy and paste the key from your questionnnaire, or the name from the embedded data settings on your task screen, straight into the field where you are using it later.
You're viewing the support pages for our Legacy Tooling and, as such, the information may be outdated. Now is a great time to check out our new and improved tooling, and make the move to Questionnaire Builder 2 and Task Builder 2! Our updated onboarding webinar is a good place to start.
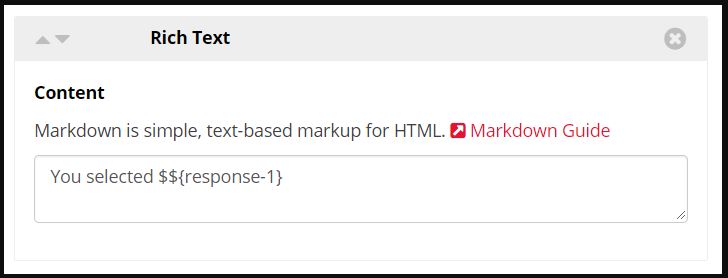
To present participants with one of their previous responses, add a Rich Text widget to your questionnaire. In this widget, type $${questionKey}.
The answer will then appear in this space.
This can also be used to retrieve an answer from a task or another questionnaire; just add in the correct embedded data key/name.
You can show participants their results by creating a Rich Text Zone.
In this zone, enter the following: $${embeddedDataName}.
The embedded data value will then be displayed in this space.
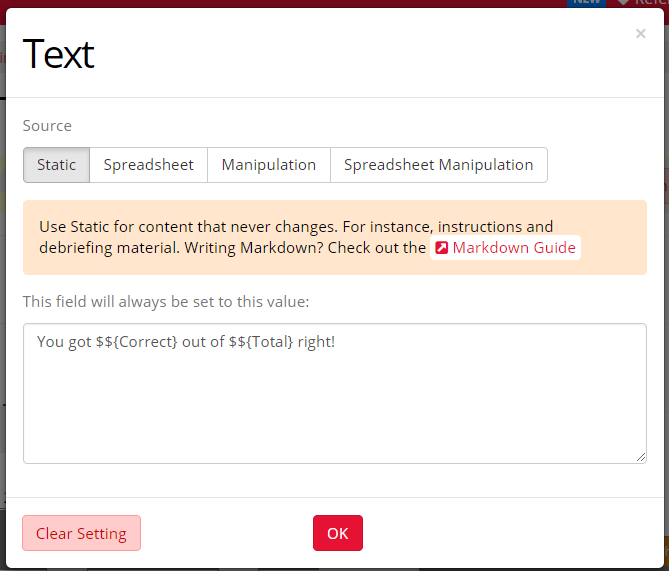
This can also be used to retrieve a response from a questionnaire or another task -- just add in the correct embedded data key/name.
We have created an Example Task that uses embedded data to display correct out of total trials.
We have an Example Task that uses embedded data in conjunction with the spreadsheet to display correct out of total trials, separated by rounds.
We have an Example Task that uses embedded data in conjunction with the spreadsheet to display correct hits and false alarms.
Watch this video guide to see how to set up embedded data to show participants their scores for two separate categories of trials within the same task.
Watch this video guide to see how to set up embedded data to show participants their most recent response on a feedback screen after each trial.
You're viewing the support pages for our Legacy Tooling and, as such, the information may be outdated. Now is a great time to check out our new and improved tooling, and make the move to Questionnaire Builder 2 and Task Builder 2! Our updated onboarding webinar is a good place to start.
Branch Nodes allow you to send participants down different experiment paths based on their Questionnaire answers or Task responses.
After you have stored your answer or score as embedded data, you need to add a Branch Node.
For your Branch Node to work correctly, it needs to know what data to search for, and who to send down each branch.
You will always need to set up a minimum of two branches, one of which is set to a specific response or range of values, and a default. The two branches, when combined, will then represent the full range of responses your participants can give, so that no participant becomes stuck at the Branch Node.
To set up your Branch Node, click on the Node.
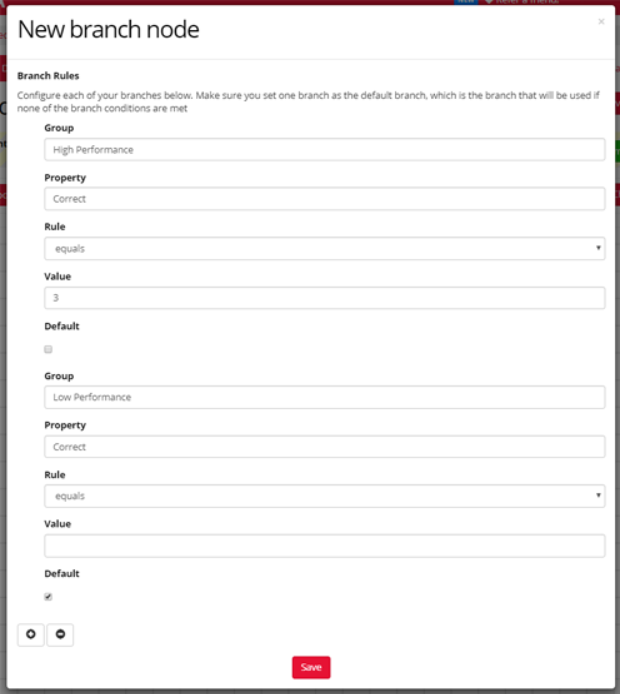
Branch Name is the label you give to your branch.
You then need to set up the conditions participants must meet to go down this branch.
From the first dropdown, select (Enter Manually). In the box below, enter your question 'Key', or the name you gave your embedded data within the Task Builder. This tells the Branch Node what question the branch refers to.
From the second dropdown, select the comparison rule you want to use to compare the embedded data to your reference value.
In the final box, enter the reference value you want to compare your embedded data to. This can be numeric, such as the number of correct responses, or the name of one of your response options.
Press + Add at the bottom of the screen to add in another branch.
Your default branch can be configured by inputting a Branch Name and checking the Default option.
Once your branches have been set up, your Branch Node will be able to link to one node per branch, e.g. if two branches are configured, you can create two different task paths.
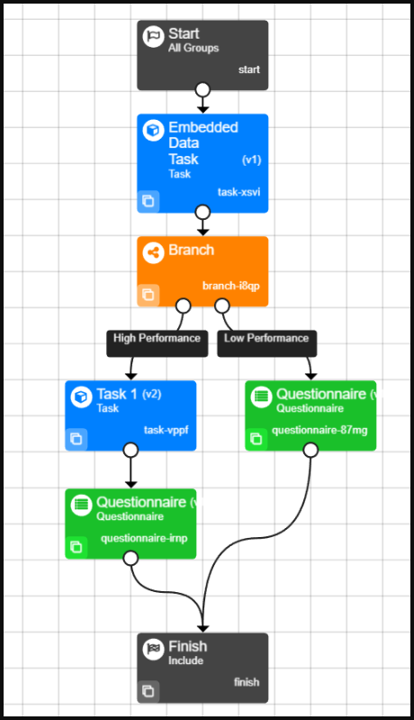
A common reason to use embedded data with a branch node is in order to reject participants who do not meet your experiment requirements. This could be because they don't fit into your target group based on your exclusion criteria, because they gave an incorrect response to an attention check, or, as in the example below, simply because they did not agree to your consent form.
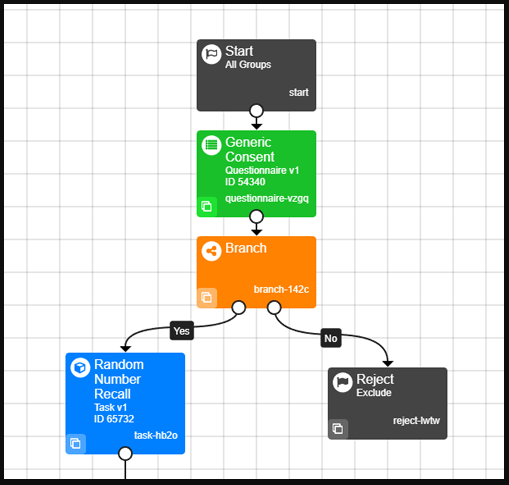
See our Questionnaire Branching Worked Examples for more details on how to send participants to a Reject Node based on their response to an age question or their response to to a multiple choice question.
We have created an example experiment that uses embedded data in conjunction with the Branch Node to send participants down different paths based on their response to one critical trial in a Task.
We have created an example experiment that uses embedded data in conjunction with the Branch Node and the Early Exit button to send participants to easy, medium or hard versions of a task, depending on how far they got in a screening version of the task.
Using Embedded Data from Repeated Versions of the Same Task
In experiments where the same participant does the same task more than once, using embedded data becomes a little more complicated.
Imagine we give participants a task. Participants who get over 70% should be sent to a longer version of the same task and participants who get under 70% to a shorter version.
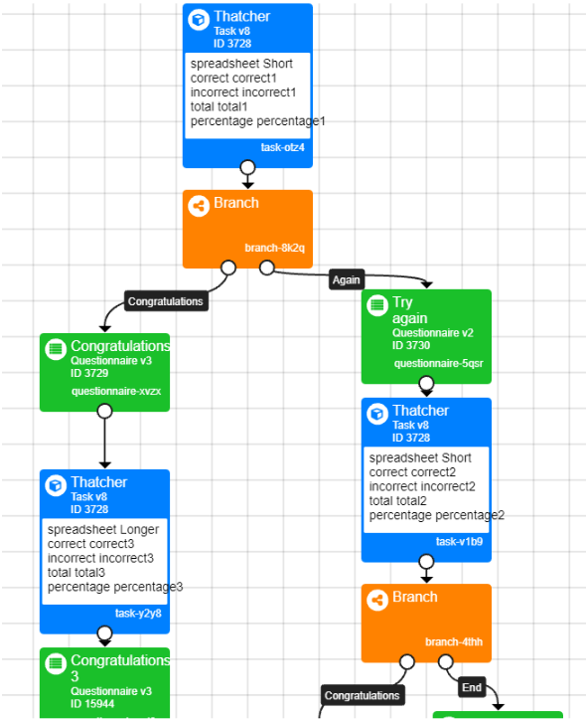
In the experiment tree below, the participant does the Thatcher task. The participant's percentage correct is saved as static embedded data under the name 'percentage'. Based on this data, the participant should then be sent either to a longer (left branch) or a shorter (right branch) version of the same task. The right-branch participants should then be directed to a 'Congratulations' screen if they got over 70% on their second try, or 'Better luck next time' if they got under 70%.
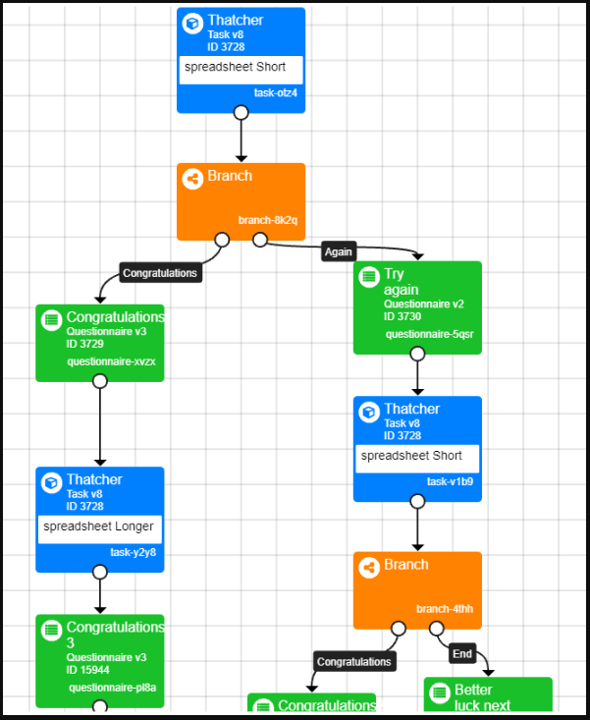
You may have noticed a problem here. If the embedded data name is set as static, it will have the same name ('percentage') across all versions of the task in the Experiment Tree. This means the percentage correct will accumulate, instead of being reset when the participant starts the second iteration of the task. This could lead to incorrect branching.
You can avoid this by setting your embedded data keys/names as manipulations.
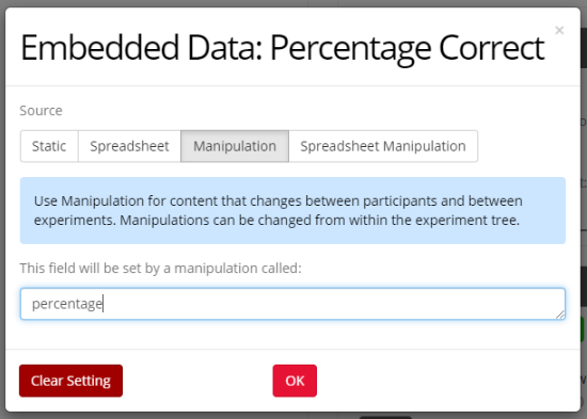
This will allow you to set a unique embedded data name for each version of the task. You can set these up by clicking each individual task node in the Experiment Tree.
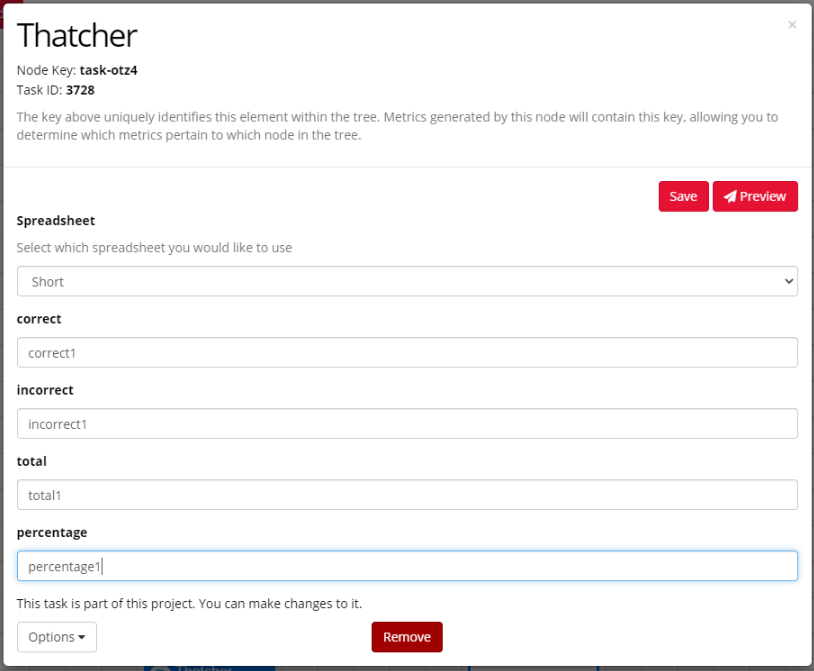
Watch this video guide to see another example of how to set up embedded data in conjunction with Task Manipulations.
We have created an example experiment that uses embedded data in conjunction with Task Manipulations and Branch Nodes to direct participants to a harder version of a task if they score over 70%.
NOTE: Using Manipulations will only work if the different iterations of the task are represented by separate nodes in the Experiment Tree. If the participant is instead sent back to the same node repeatedly, for example when using the Repeat Node, then you will need to use scripting to reset the embedded data for each repeat. We have created an example script that resets embedded data for you to use in our own tasks.
We have created an example experiment that uses scripting in conjunction with the Branch Node and the Repeat Node to make participants repeat a task if they did not reach a given score criterion.
You can find out more about the Branch Node configuration settings in the Experiment Tree Tooling Reference Guide.
You're viewing the support pages for our Legacy Tooling and, as such, the information may be outdated. Now is a great time to check out our new and improved tooling, and make the move to Questionnaire Builder 2 and Task Builder 2! Our updated onboarding webinar is a good place to start.
You can also use embedded data in the Script Tab. In order to do so, you'll need to use two paired functions: gorilla.store, for storing embedded data, and gorilla.retrieve, for accessing embedded data for later use.
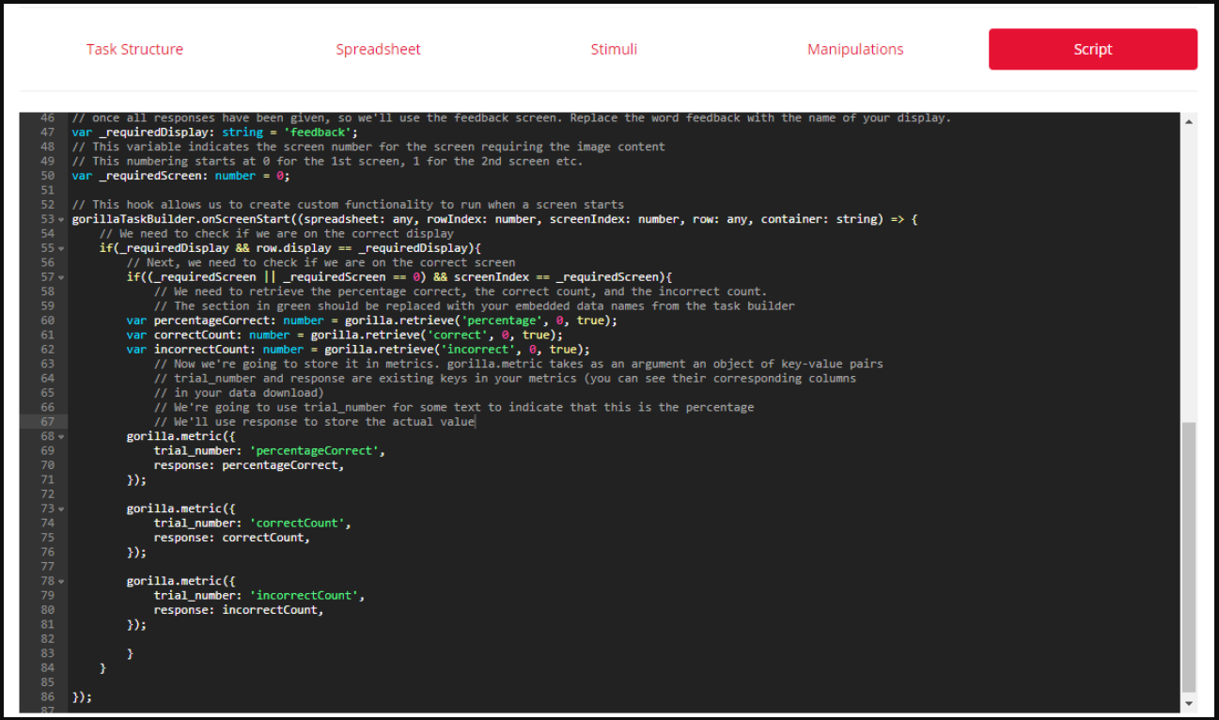
Note that by default, embedded data is not included in your downloadable metrics at the end of the experiment. This default behaviour can be changed using scripting. Here's an example script which adds your embedded data to your metrics: Save Embedded Data to Metrics task example.
Once your embedded data is in your metrics, you can use this to add custom functionality to your task. You may want to use advanced scoring, or use embedded data to manipulate task flow.
We have created an example task that uses gorilla.store and gorilla.retrieve to access and update the participant's current total score and display it on screen.
Check out a Gorilla Academy case study that implements this functionality in the context of a real experiment.
Take a look at our Task Builder Script Examples for other ideas, or adapt one for your own use.
You're viewing the support pages for our Legacy Tooling and, as such, the information may be outdated. Now is a great time to check out our new and improved tooling, and make the move to Questionnaire Builder 2 and Task Builder 2! Our updated onboarding webinar is a good place to start.
You can use embedded data within the questionnaire builder to combine answers into scores, reverse score, and separate participants into high, medium or low groups. This is achieved by entering some javascript into the script widget.

Combining answers requires several stages. This example uses Likert scale questions.
First, after checking the embedded data box, you need to ‘retrieve’ the embedded data so that the script widget can use the embedded data. Input the code:
var response1normal = parseInt(gorilla.retrieve('response1', 4, true)); var response2reverse = 8 - parseInt(gorilla.retrieve('response2', 4, true)); This retrieves the embedded data ‘response1’ (question key for response 1) and ‘response2’ (question key for response 2).
It makes the default value (if no response is given) 4, makes sure the answer is an integer, and names this transformed data ‘response1normal’ and ‘response2reverse’ respectively.
Then you need to combine the scores. You can do this by averaging the scores for the variables response1normal and response2reverse, and naming this as a 3rd variable, score.
var score = (response1normal + response2reverse) / 2;
The next job is to store this new variable within embedded data so that we can branch participants according to it.
gorilla.store('score', score, true); ‘score’ will now be the key we can enter into our branch node, just as you would with a question key.
The last step is to store this data to metrics.
gorilla.metric({ question_key: 'score', response: score, })
This data will now be uploaded under the column labelled response.
For further detail on how to use the script widget with embedded data, and how to separate participants into groups, see the Scripting in the Questionnaire Builder walkthrough.
Information on using embedded data within the questionnaire builder is also available in the Storing Embedded Data section of this guide.
You can score in the Task Builder in a similar way, through the script tab instead of the script widget. Gorilla will automatically count the number of correct and incorrect answers for you if you set a correct answer and use the embedded data settings.
Check out 'Using Embedded Data in the Task Script Tab' to see how to retrieve embedded data for use in the Script Tab. Remember to retrieve the embedded data at the right point - if you want to use specific text answers rather than just a percentage or count, you'll need to run a script at the end of every trial using gorilla.onScreenFinish. We have created an example task that uses this function to display all of a participant's answers on the end screen of a task.
After you've retrieved your embedded data, you can use steps 2, 3, and 4, in the Questionnaire Builder example above to add your custom scoring. If your scoring is more complicated, requiring if and else statements, please take a look at our Task Builder Script Examples.
You're viewing the support pages for our Legacy Tooling and, as such, the information may be outdated. Now is a great time to check out our new and improved tooling, and make the move to Questionnaire Builder 2 and Task Builder 2! Our updated onboarding webinar is a good place to start.
In this example we have a single question in a questionnaire which asks participants their age. If their age is below 18 they are rejected from the experiment. This example can be easily adapted to create a custom consent form by having only two radio buttons, 'consent' and 'do not consent'.
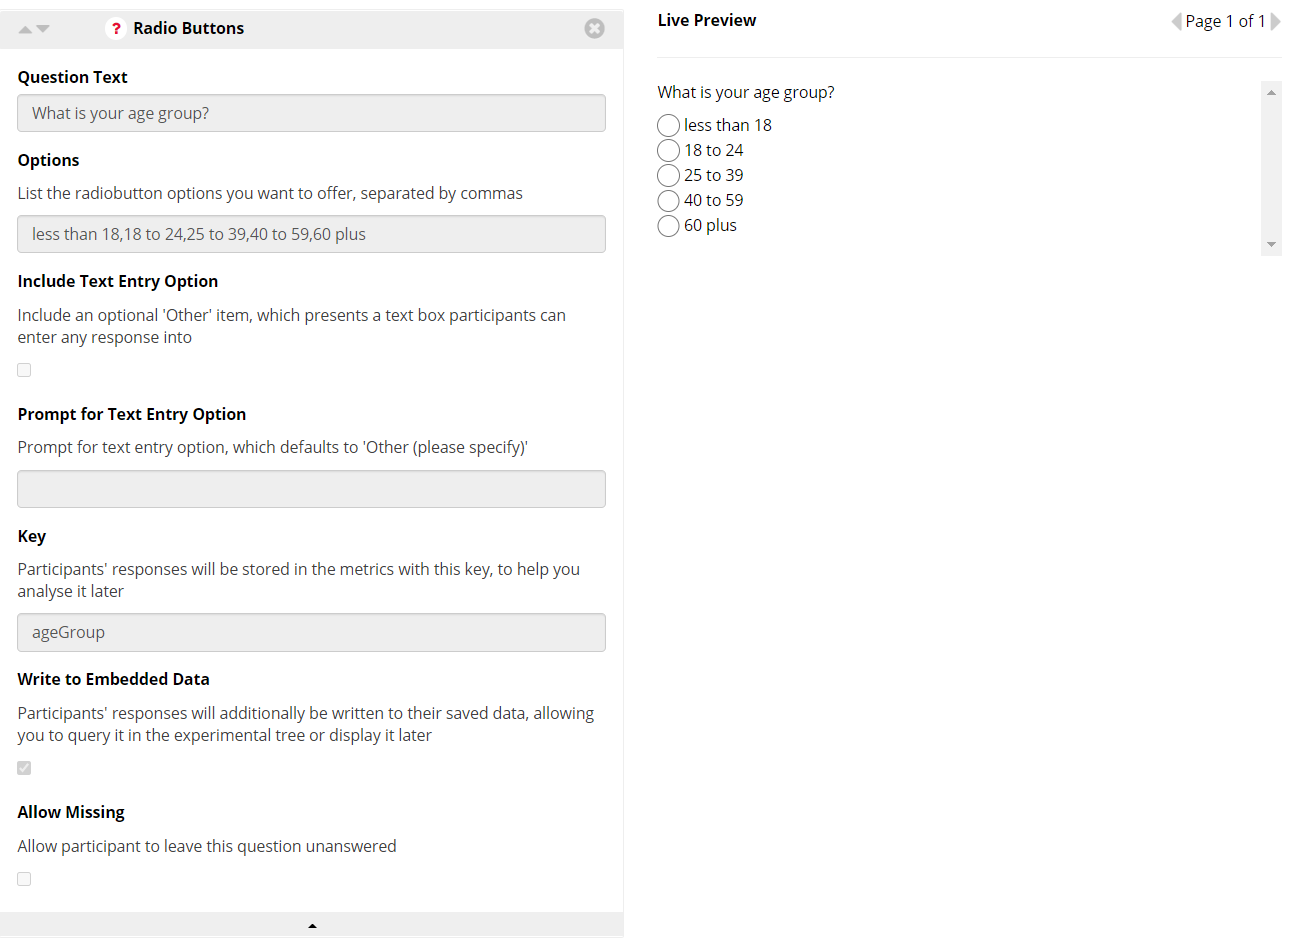
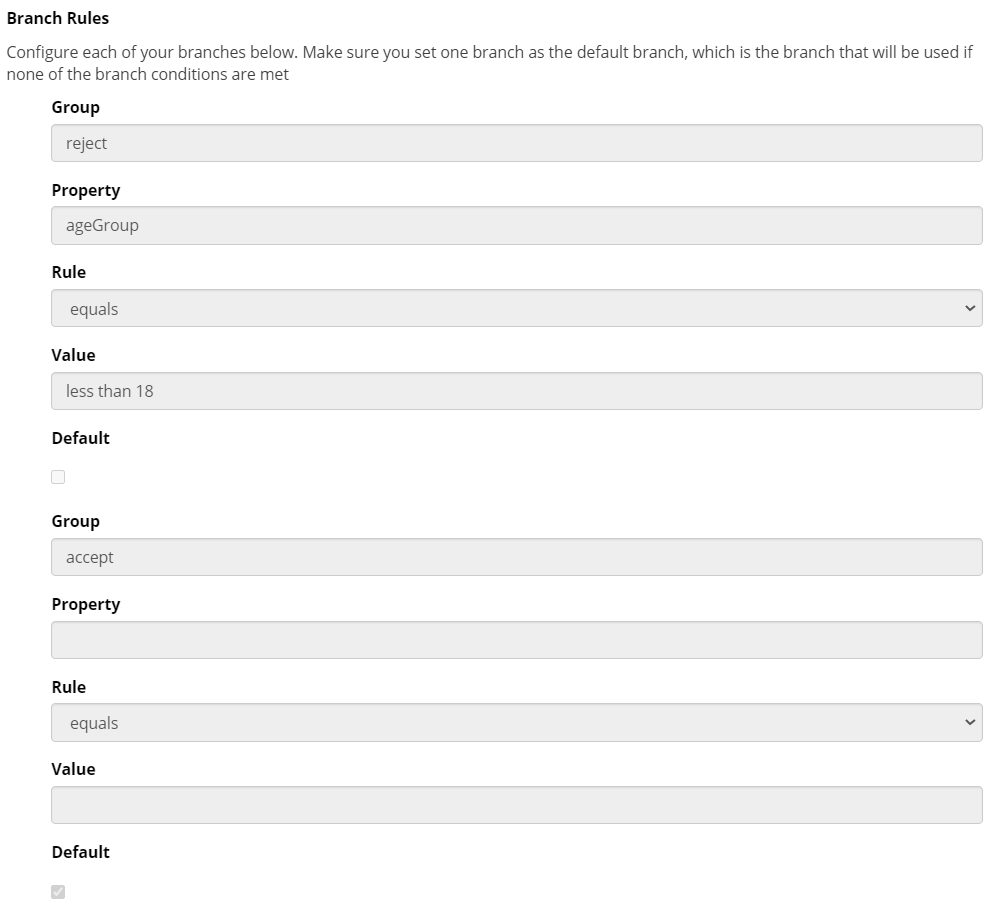
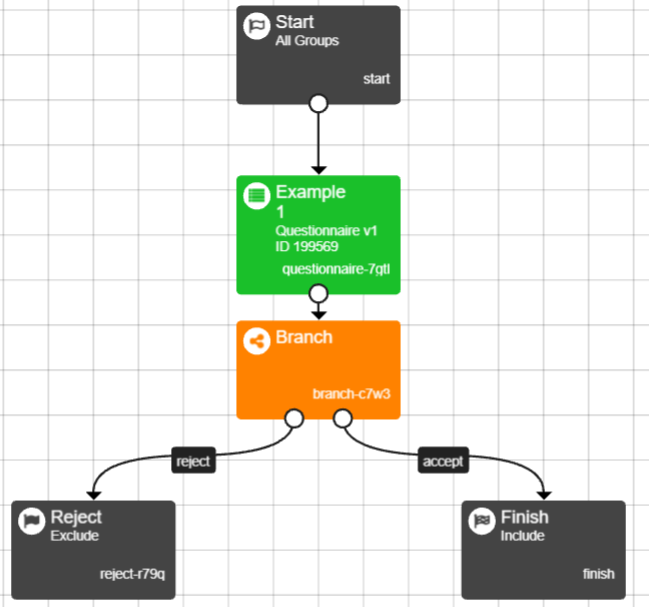 ---
---
You're viewing the support pages for our Legacy Tooling and, as such, the information may be outdated. Now is a great time to check out our new and improved tooling, and make the move to Questionnaire Builder 2 and Task Builder 2! Our updated onboarding webinar is a good place to start.
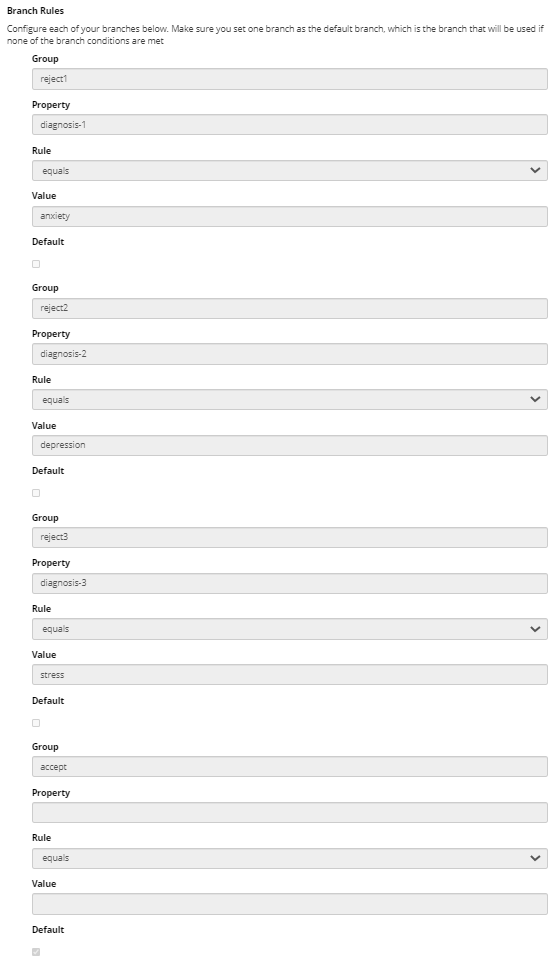
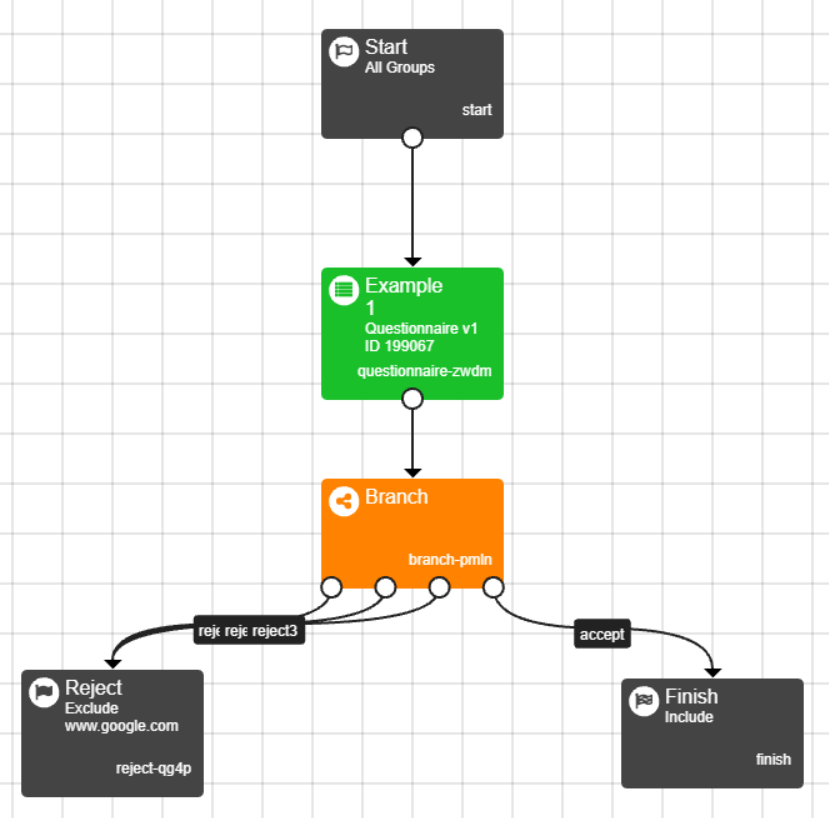
In this example we have a series of questions in a questionnaire which ask participants whether they suffer from the given diagnoses. If they answer yes to any of the diagnoses they are rejected from the experiment.
Set up the question in the questionnaire. We have chosen to use checklist buttons for each of the diagnoses but in your questionnaire the responses need not be the same widget.
Choose keys to refer to the responses later and check the embedded data option. For a checklist the keys are automatically numbered.
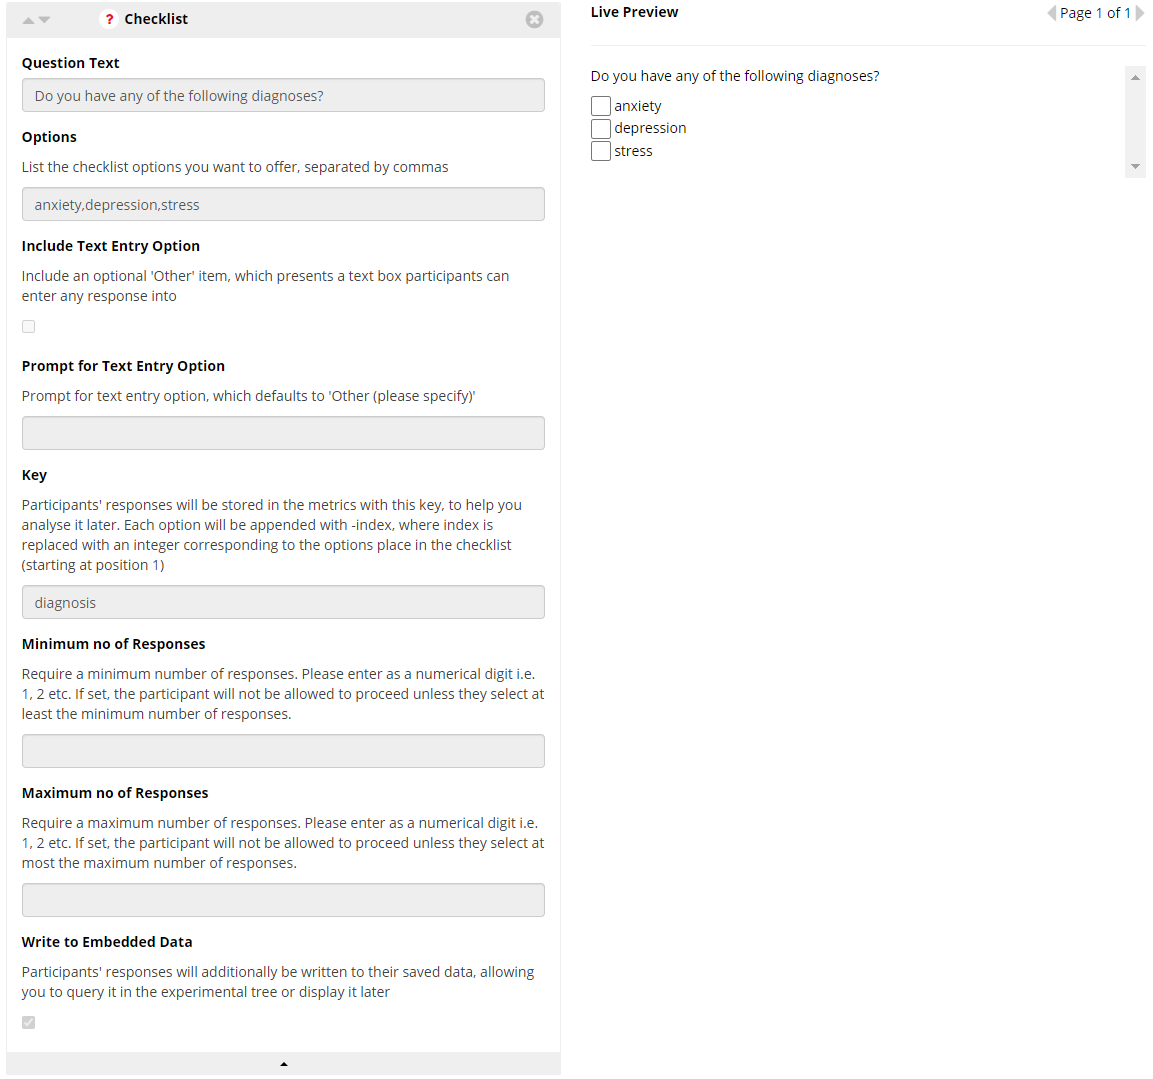
In the experiment tree add a branch node after the questionnaire.
Create as many branches as you have questions, as well as an accept branch. For the reject branches, select (Enter Manually) from the first dropdown and enter the question key in the box below.
Use the second dropdown and the final box to define an appropriate rule. In this example, if the box is checked we want to reject the participant, so the rule is if the value is equal to the name of the checkbox. You do not need to enter any rule for the accept group as if none of the reject rules are satisfied the participant will go down this branch. You must set it to default.
You're viewing the support pages for our Legacy Tooling and, as such, the information may be outdated. Now is a great time to check out our new and improved tooling, and make the move to Questionnaire Builder 2 and Task Builder 2! Our updated onboarding webinar is a good place to start.
This video shows you how to use embedded data settings to show participants their scores for two separate categories of trials within a task.
Length (mins): 4:27
You're viewing the support pages for our Legacy Tooling and, as such, the information may be outdated. Now is a great time to check out our new and improved tooling, and make the move to Questionnaire Builder 2 and Task Builder 2! Our updated onboarding webinar is a good place to start.
This video shows you how to use embedded data settings to show participants their most recent response on a feedback screen after each trial.
Length (mins): 6:03
You're viewing the support pages for our Legacy Tooling and, as such, the information may be outdated. Now is a great time to check out our new and improved tooling, and make the move to Questionnaire Builder 2 and Task Builder 2! Our updated onboarding webinar is a good place to start.
This video shows you how to use embedded data in conjunction with Task Manipulations to reset participants' scores when they repeat different versions of the same task.
Length (mins): 6:50