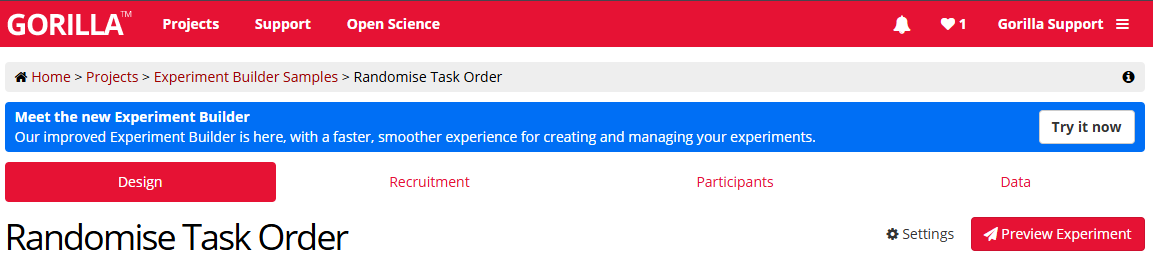
Welcome to the new look Experiment Builder
- What's new?
- Classic vs new
Overview
Gorilla's Experiment Builder provides a visual interface for constructing your participants' journey through your study. This allows you to implement counterbalancing, randomisation, redirects to external sites, and more, without the stress of coding or managing your own data storage.
While the core functionality is tried and tested, there was room for improvement in the user interface. And so we've given Experiment Builder a facelift, refining the existing interface for a smoother building experience:
- Create activities (tasks and questionnaires) directly within your experiment, making it easier to stay in flow
- Automatically update nodes to the latest version, including open changes, keeping all your progress in sync
- Clearer visual indicators when editing nodes, so it's easier to spot and fix issues as you build
- Zoom out to see your whole experiment at a glance
- And much more!
It's the same Experiment Builder, just more streamlined and intuitive - helping you move from setup to insight with less friction.
Browse the list of topics in the menu for more on what's improved!
Design tab
Smoother integration of experiments and activities
You can now create task, questionnaire, game, and shop nodes from within the experiment tree. Just click the blue plus button wherever you want to add a new activity for your participants - you can start editing it immediately, or leave it as a placeholder and come back to make changes when you're ready using the 'Continue Editing' button.
We've also now introduced one-click activity editing from within the experiment. Click your activity node, then choose whether you simply want to View it, or to immediately start making changes by clicking Edit.
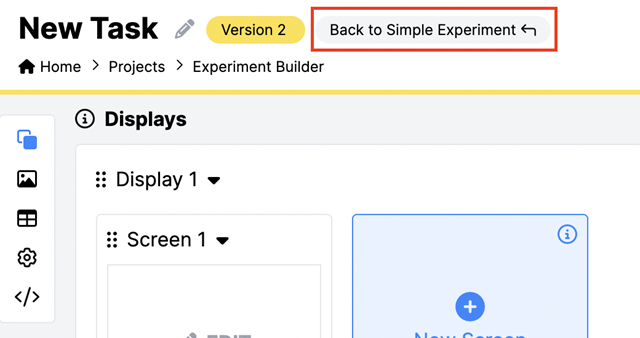
Finally, we've also made it easier to go back and forth between activities and experiments. A new button in the Task Builder, Questionnaire Builder, and Game Builder lets you return with one click to the experiment you were working on:
Better updating
We've introduced a host of new safeguards to help you ensure all your nodes are updated to the latest version (a common cause of previews not working as expected within experiments).
New nodes added to an experiment will have Auto-update enabled by default. This means the node will automatically reflect the latest changes made to the task or questionnaire, including open changes.
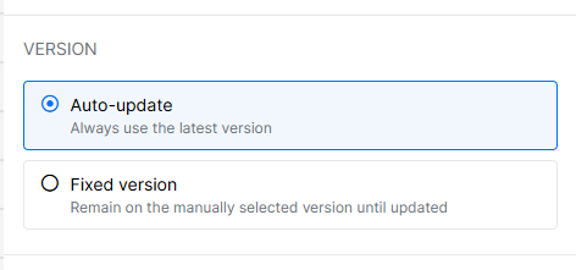
Alternatively, you can select Fixed version to use a specific version of an activity in the experiment.
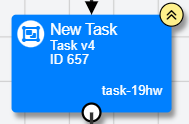
New visual indicators now let you assess a node's status at a glance. If you're making changes to a node, it appears with a pencil icon at the top-right:
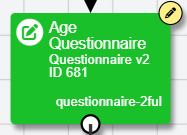
If a node set to Fixed version has a newer version available, the node appears with two upward arrows at the top-right:
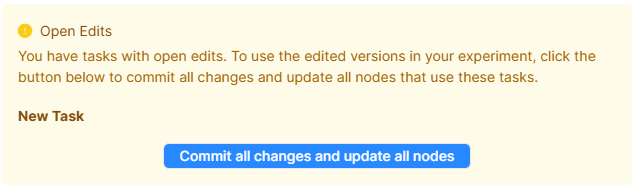
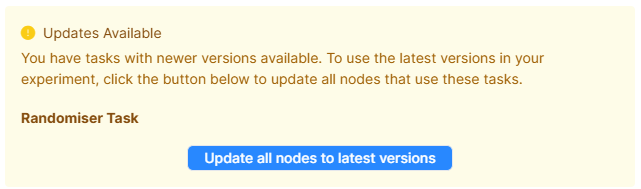
When you commit the experiment, Gorilla auto-commits any changes to activity nodes that are set to Auto-update. For nodes set to Fixed version, Gorilla alerts you if any nodes still have open changes, and/or if any are using older versions. You can then choose whether to commit and update these nodes to the latest version in a single click:
We've also pulled the 'Update Nodes' button, which automatically updates all your nodes to the latest version, out of the sub-menu it was in before and placed it on the main header, so it's easier to find.
Better Performance
Users with large, complex experiment trees found the Design tab would become slow to load and interact with (or sometimes stop working altogether!). We've completely rebuilt how we draw the experiment tree so it should scale better with more nodes and an even larger experiment canvas. We've also reworked how a lot of actions on the Design tab load and run, so the experiment canvas needs to refresh much less frequently.
Zoom in and zoom out
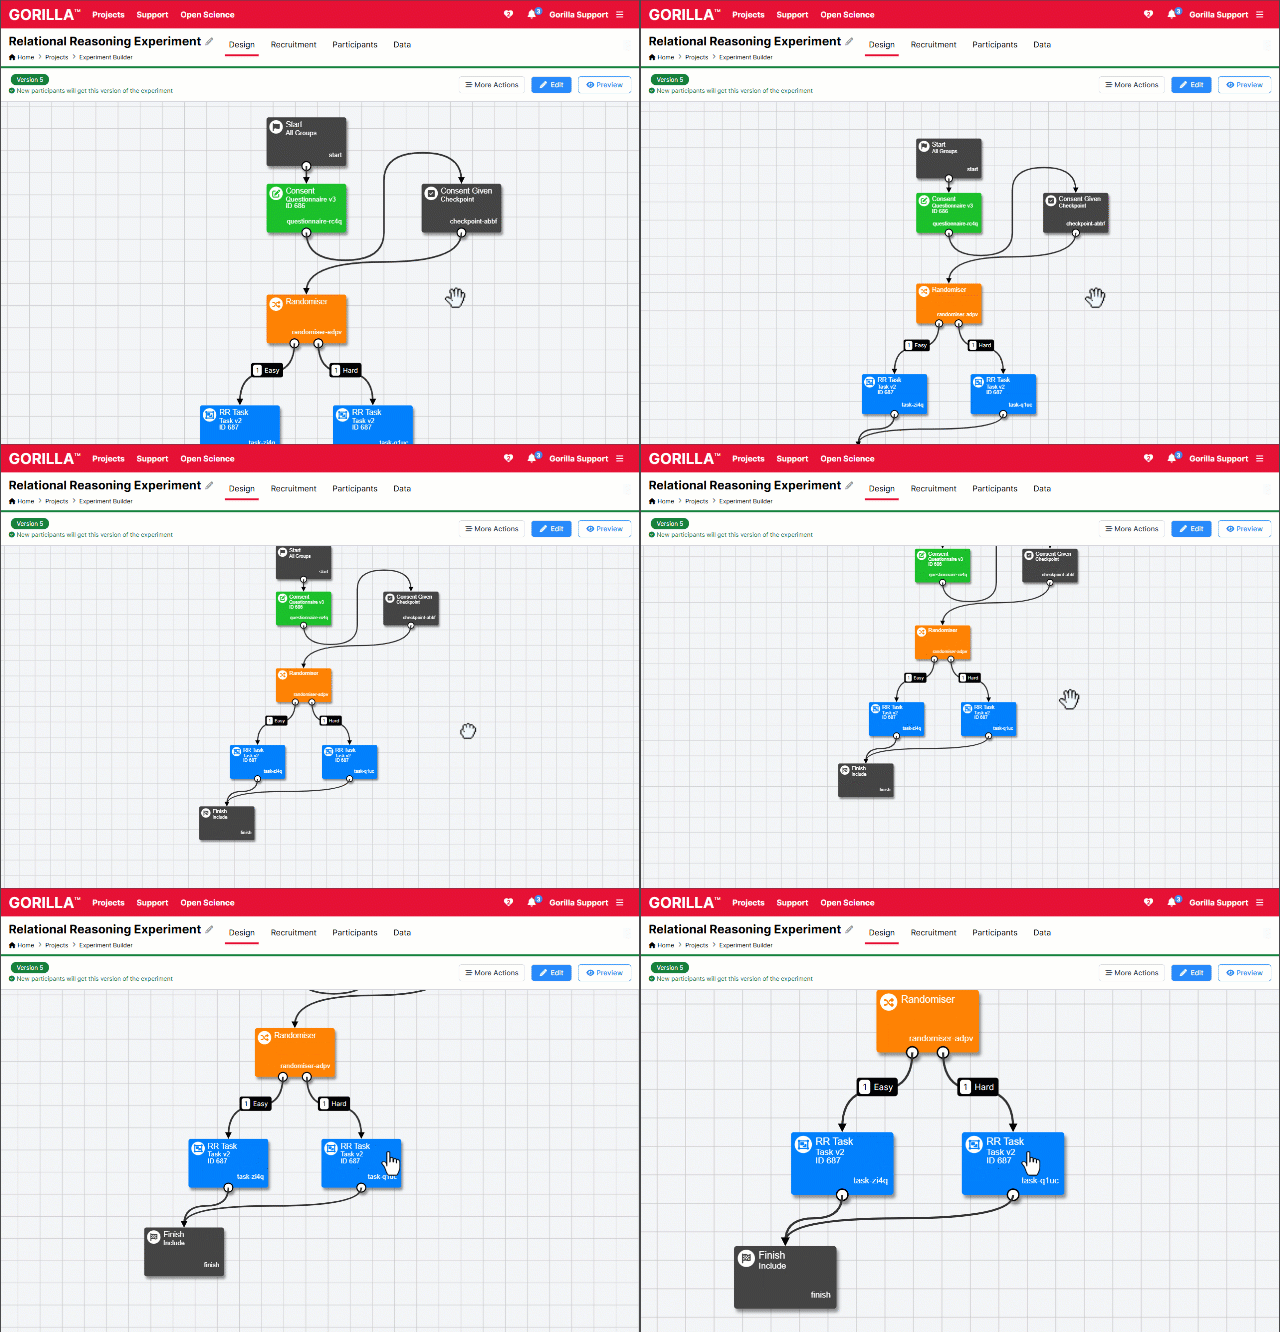
You asked - and we did! The top requested feature on our roadmap was for the ability to zoom in and out of the experiment canvas, and at long last the changes we mention above also allowed us to implement this in the new look Experiment Builder. See all of your experiment in a single screen and navigate with ease.
Better Tree Interactions
Tree nodes are more visually dynamic, with a node's connections moving with them when you drag and drop. This makes it easier to see how nodes in the tree are connected together. You can also directly delete connections, rather than having to delete the whole node. When trying to make new connections, nodes that are available to connect to will automatically highlight.
Refreshed user interface
We've modernised the UI, making full use of wide screen devices (rather than limiting to a 4:3 window). We've also replaced almost all pop-up modals with a side menu, allowing you to perform most activities while still being able to view and interact with the experiment tree. We've also brought to the forefront some important, time saving tools like "Update Nodes" and "Check Errors" that were previously hidden behind other menus.
More consistent creation and editing experience
When creating or duplicating nodes, there were some nodes that required more steps than others and a few that would require you to first add them to the tree and then organise their settings. We've unified the experience now, creating a single flow for creating new nodes in the tree. All nodes share the same UI structure as well.
In-situ documentation
While our exceptional support team always love to hear from you, it's always more satisfying to get to the answer yourself. To help you find out what everything does, we've introduced a wealth of tooltips to the interface, covering everything from UI buttons to node settings. Some of these tooltips also include links out to the main support documentation site.
Better error checking
The Gorilla error checker can help you find and resolve some of the common issues that arise when building an experiment. We've pulled this out of the sub-menu it was in before and placed it on the main header, so it's easier to find. When Gorilla finds errors it will (as well as list them out) highlight them in the tree.
Improved consistency across the Gorilla tools
Before, actions that were shared across Experiment Builder and our other tools (for example, cloning, cancelling changes, and accessing version history) were in different menus and locations. Now, we've harmonised all of these into a More Actions menu that is the same across Experiment Builder, Task Builder 2, Questionnaire Builder 2, and Game Builder.
Recruitment and Participants tabs
A fresh look
The updates to the Recruitment and Participants tabs mostly focus on bringing across the new look, with a few quality of life updates.
More information
You'll now find links to our support documentation throughout the new look Recruitment Tab. Follow the icons for more information about the recruitment policy you've selected, setting a time limit, or adding recruitment requirements.
The Participants tab now includes time information in the Activated column, giving you finer-grained data on your participants at a glance.
Data tab
Fewer clicks
The data generation panel is now open by default when you navigate to the Data tab, reducing the number of clicks between you and your data.
More information
You'll now see handy tooltips on data generation settings. We've also added header text detailing how many participants you should expect to download on the current experiment version, as well as how many participants are included in other versions. You can then use this information to decide whether to combine data across experiment versions when generating your data.
Design tab differences
To make it easier to get to grips with the new layout, this page will give you all you need to know about where to find the settings you're used to in the new look Experiment Builder.
Experiment-wide actions
Actions that apply to the whole experiment are still mostly located at the top-right of the Design Tab.
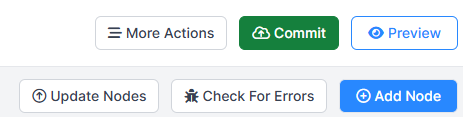
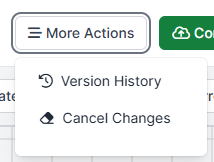
When the experiment is open for edit, available actions are Commit, Preview, Update Nodes, Check For Errors, and Add Node. From the More Actions menu, you can view the Version History of the experiment, or cancel your current changes.
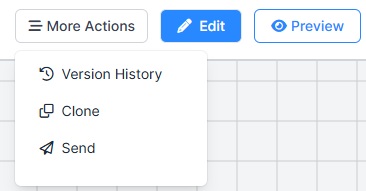
When the experiment is committed, available actions are Edit and Preview. From the More Actions menu, you can view the Version History of the experiment, clone the experiment, or send it to another user's library.
To add or change the Name or Description of the experiment, use the pencil icon next to the experiment name at the top-left.
Adding new nodes
In the classic version of the builder, you could choose a node type from the toolbar above the canvas or select 'Add New Node' - they did the same thing.
Once you chose the node you wanted, it would automatically place itself on the tree (not necessarily where you wanted it, and occasionally out of view!)
In the new look builder, you can use the blue plus buttons to add new nodes specifically where you want them. Alternatively, use the Add Node button at the top-right to first create a node and then place it. Either way, it's one continuous journey. Add a node, select your node type, apply any relevant settings that the node might need, and the node will be created.
The whole time, you can see and interact with the experiment tree.
Node-specific actions
In the classic version of the builder, you'd need to click on the node to bring up its settings, obscuring your view of the overall experiment tree. From the pop-up modal, you could edit and save its settings, swap it for a different version, remove the node, etc.
In the new look builder, clicking the node brings up a side panel with all your settings in one place, which allows you to still see and interact with the experiment tree.
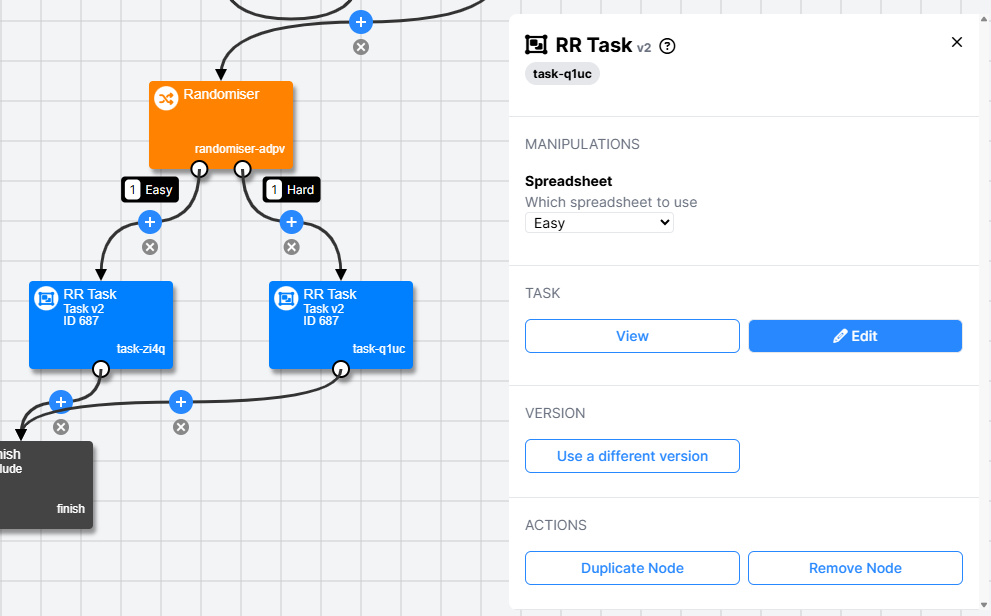
For activity nodes (tasks, questionnaires, games, and shops), along with the existing option to View the activity, there is also now an Edit button, allowing you to open a new edit on the activity with one click.
All node settings also now auto-save, removing the need for a Save button.
Auto-update nodes
In the classic version of the builder, you'd need to manually update node versions when you've made changes. In the new look builder, new nodes added to an experiment have Auto-update enabled.
When Auto-update is enabled, the node will automatically reflect the latest changes made to the task or questionnaire, including open changes that have not yet been committed. When you commit your experiment, Gorilla will also automatically commit any open changes in tasks or questionnaires that have Auto-update enabled. This ensures the experiment is using the latest version of the activity.
By selecting Fixed version, you can choose a specific version of the selected task or questionnaire. When Fixed version is selected, the node will remain on the version you choose and will not automatically update when changes are made. If you later want to use the latest version, you can click the Update Nodes button, or select Auto-update to keep the node automatically up-to-date in future.
Data tab differences
To make it easier to get to grips with the new layout, this page will give you all you need to know about where to find the settings you're used to in the new look Experiment Builder.
The core functionality of the Data Tab is the same as before. Some buttons have changed their names and/or colours, but what they do is unchanged:
- Version Picker is now Version
- Download Consort Data is now Download Attrition Report
- Download Experiment Data is now Download All Data
All these buttons are still located at the top-right of the Data tab, as shown in the following screenshot. At the top-left, you can also see at a glance how many participants are included in the currently selected version and in other versions, rather than having to go to the Participants tab for this information.
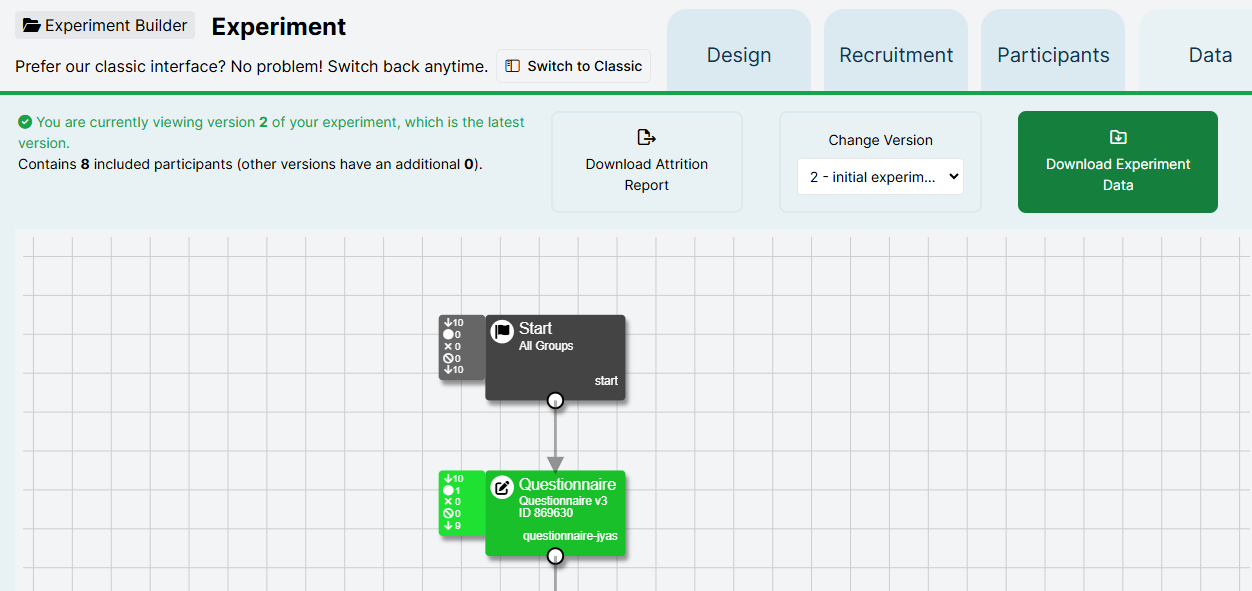
The data generation panel is open by default when you go to the Data Tab. This means you will only need to click Download All Data if you are currently looking at the data generation/download options for a specific node, and want to generate and/or download data from the whole experiment.
The other main change is that the data generation panel pops out in a side panel instead of hiding your view of the experiment tree - so you can still navigate!
Switching back to Classic
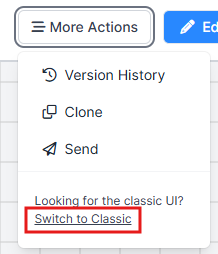
To switch back to Classic Experiment Builder, go to the Design Tab, open the More Actions menu, and click 'Switch to Classic':
Auto-update is not available in Classic Experiment Builder
If you switch back from New Experiment Builder to Classic Experiment Builder, any nodes set to auto-update will roll back to the latest committed version.
Any changes you make will be recorded across both views, and you can switch back and forth as many times as you like. To switch to the new interface again, click the 'Try it now' button in the blue banner at the top of the screen: